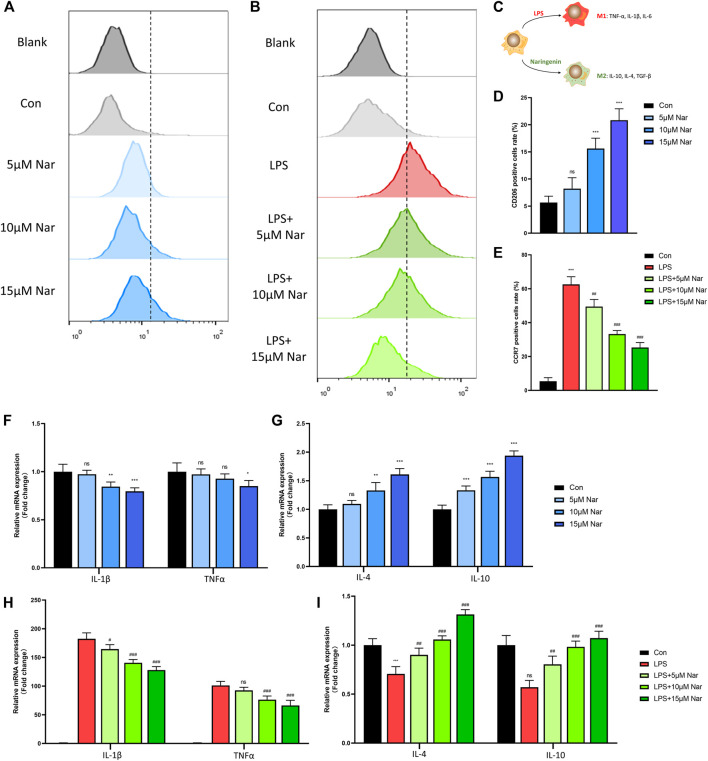
FIGURE 3.
Naringenin regulates macrophages phenotype. (A–E) CCR7 and CD206 positive cells’ percentage of total cells analyzed by flow cytometry. (C) Schematic diagram of naringenin-mediated macrophage polarization. (F-I) Expressions of anti-inflammatory cytokines IL-4 and IL-10 as well as pro-inflammatory cytokines IL-1β and TNF-α in normal and inflammatory conditions. n = 4 per group. Data are expressed as mean ± SD. * p < 0.05; ** p < 0.01; *** p < 0.001;. * compared with con group.

