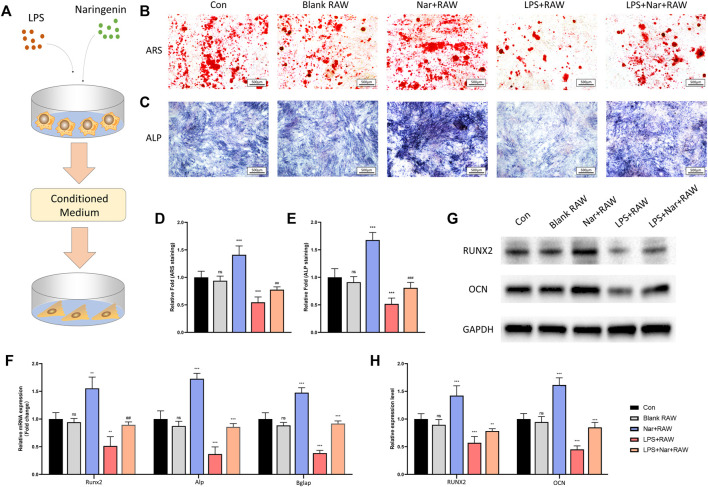
FIGURE 5.
Osteogenesis is enhanced under naringenin-modulated macrophage coculture medium. (A) Schematic illustration. (B,D) ARS staining and its quantification. (C,E) ALP staining and its quantification. (F) Transcript levels of osteoclast markers Acp5, CtsK, and Dc-stamp. (G, H) Western blot and optical density analysis of RUNX2 and OCN with GAPDH as reference. n = 4 per group. Data are expressed as mean ± SD. * # p < 0.05; ** ## p < 0.01; *** ### p < 0.001. * compared with con group; # compared with LPS + RAW group.

