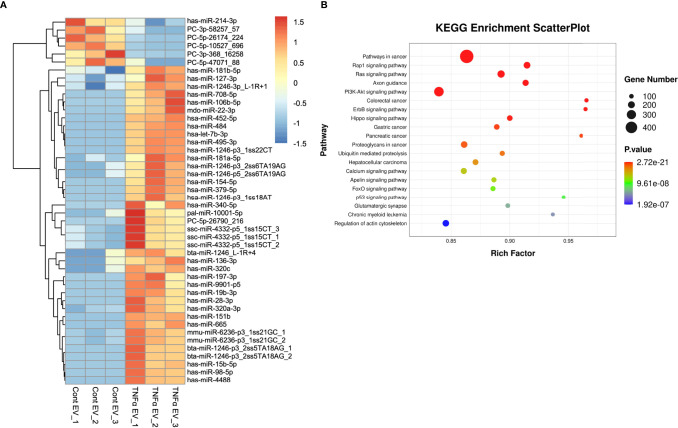
Figure 8.
miRNA components in TNFα EVs. (A) A heat map of the differentially expressed miRNAs in control and TNFα EVs (n = 3). (B) KEGG analysis of relevant pathways significantly affected by differentially expressed miRNAs in TNFα EVs. Statistical significance (P < 0.05) was determined by performing Fisher’s exact test.

