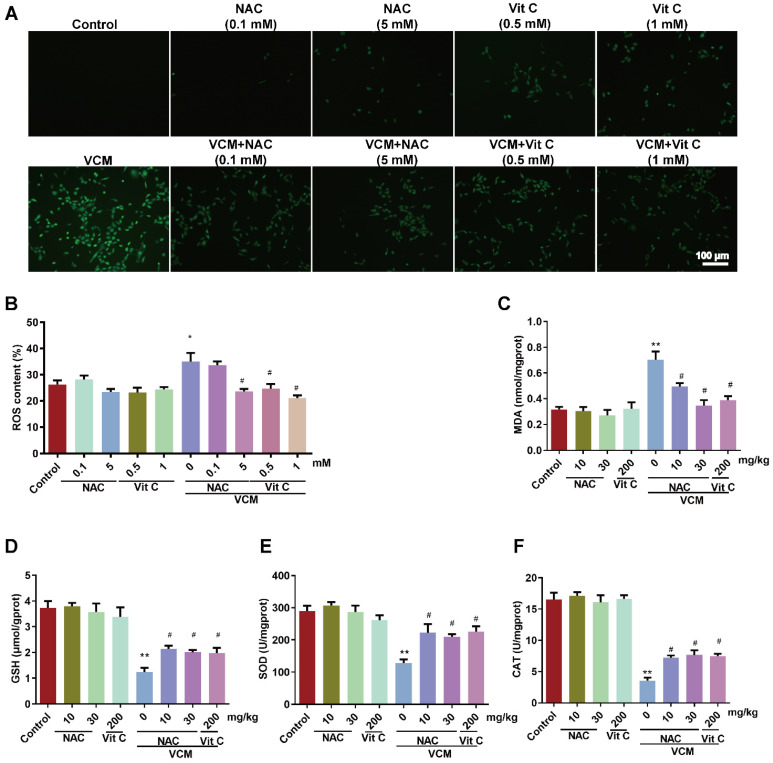
Figure 5.
Effect of NAC on oxidative stress induced by VCM in HK-2 cells and rat kidneys. (A) ROS production in HK-2 cells detected by immunofluorescence. (B) Quantified analysis of ROS levels in HK-2 cells. (C) MDA contents in rat kidneys from different groups. (D) GSH contents in rat kidneys. (E) SOD activity in rat renal tissue. (F) CAT activity in rat renal tissue. Data was performed from three independent experiments or 5 rats and presented as mean ± SEM. *p<0.05, **p<0.01, significantly different compared with that in the control group. #p<0.05, significantly different compared with that in the VCM group. Significance was analyzed by ANOVA followed by Tukey's test.

