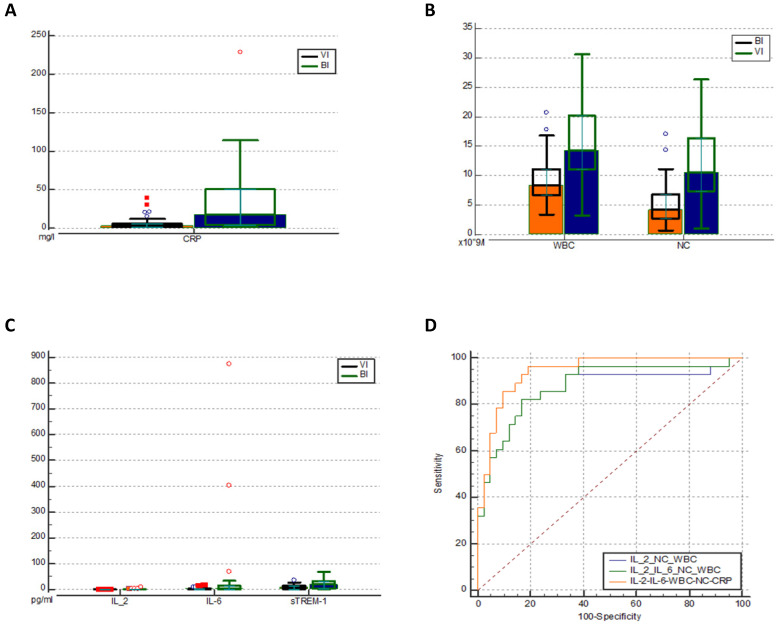
Figure 2.
Comparison of CRP (mg/l) levels (a) WBC and NC (pg/ml) levels (b) and Il-2, IL-6 and sTREM-1 levels (c) in the two groups. ROC analysis of different combinations of biomarkers for predicting BI (d). IL - interleukin; CRP - C reactive protein; WBC - white blood cells; NC - neutrophil count. VI -viral infection, BI - bacterial infection, sTREM-1- soluble triggering receptor expressed on myelocytes 1, ROC - receiver operating characteristic curve.

