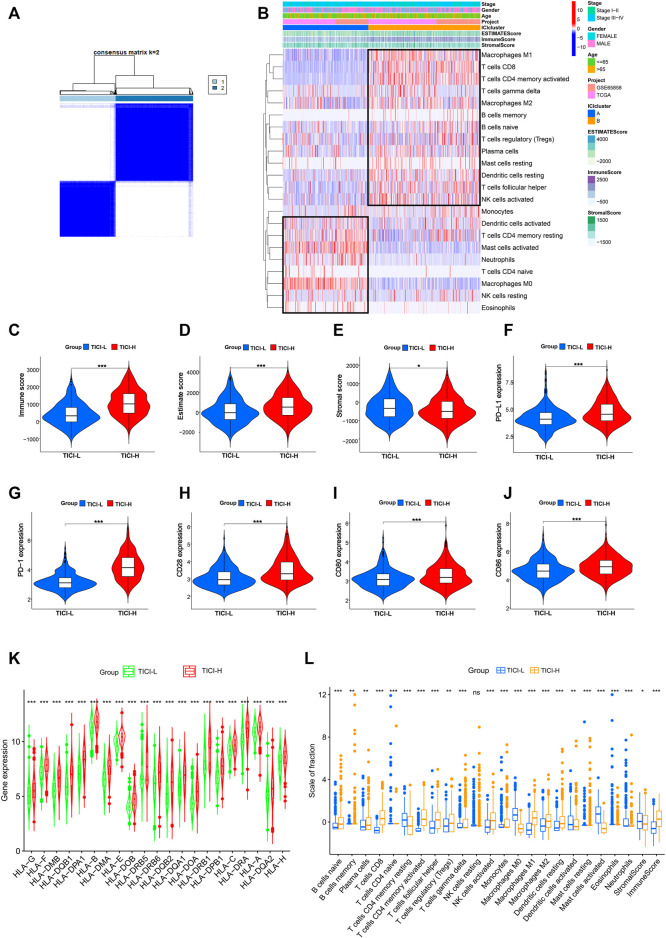
FIGURE 2.
(A) Consensus clustering matrix for k = 2. (B) Heatmap of immune-infiltrating cells. (C–E) Immune score, estimate score, and stromal score in the high- and low-TICI groups. (F–J) Expression of PD-L1, PD-1, CD28, CD80, and CD86 in the high- and low-TICI groups. (K) Expression of HLA genes in the high- and low-TICI groups. (L) Immune-infiltrating cells in the high- and low-TICI groups.

