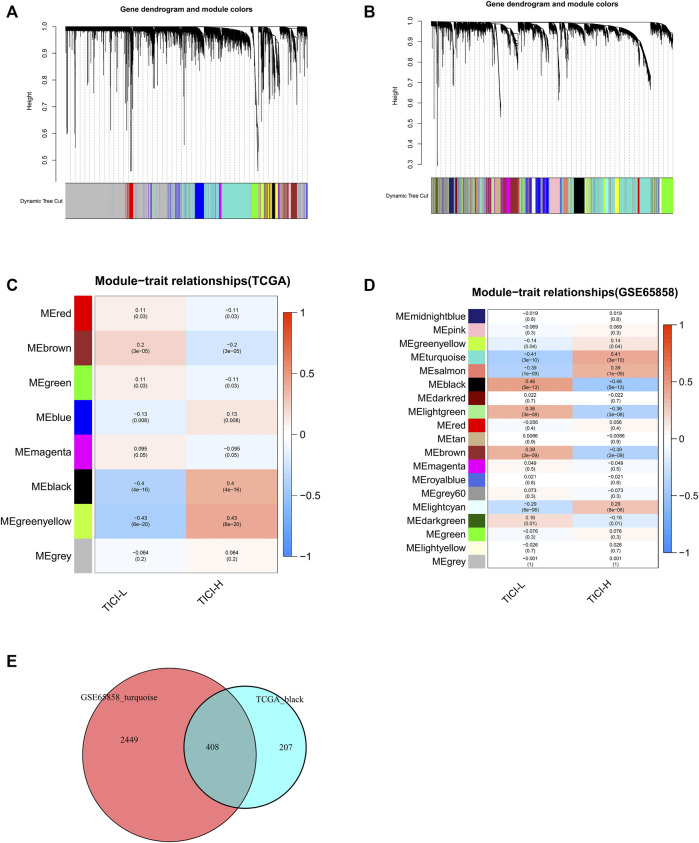
FIGURE 3.
Identification of TICI-related co-expressed genes. (A,B) Clustering dendrograms of TCGA dataset (A) and GSE65858 dataset (B). (C,D) Correlation heatmaps of different modules and TICI in TCGA dataset (C) and GSE65858 dataset (D). (E) Identification of the overlapping co-expressed genes from the black module in TCGA dataset and the turquoise module in the GSE65858 dataset using VennDiagram software.

