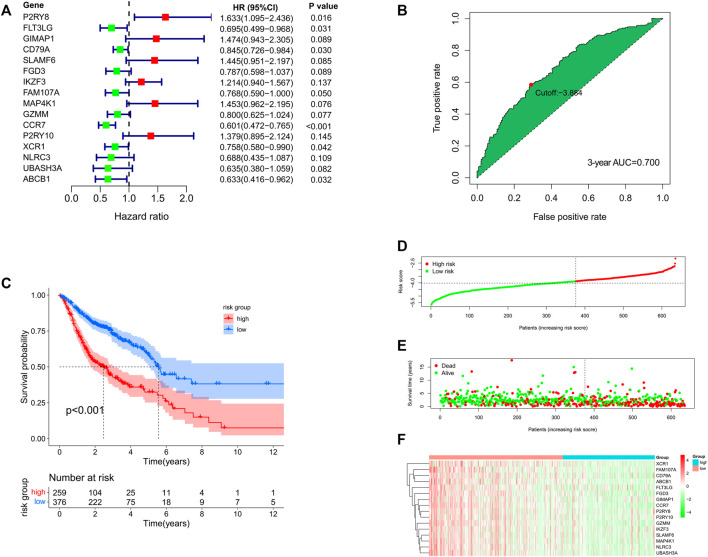
FIGURE 5.
(A) Multivariate Cox analysis for the 16 genes in the prognostic signature. (B) Best cutoff value based on the ROC curve. (C) Kaplan–Meier analysis for the high- and low-risk groups. (D–F) Distribution of risk score, survival status, and the expression feature of the 16 prognostic genes of the 635 HNSCC patients.

