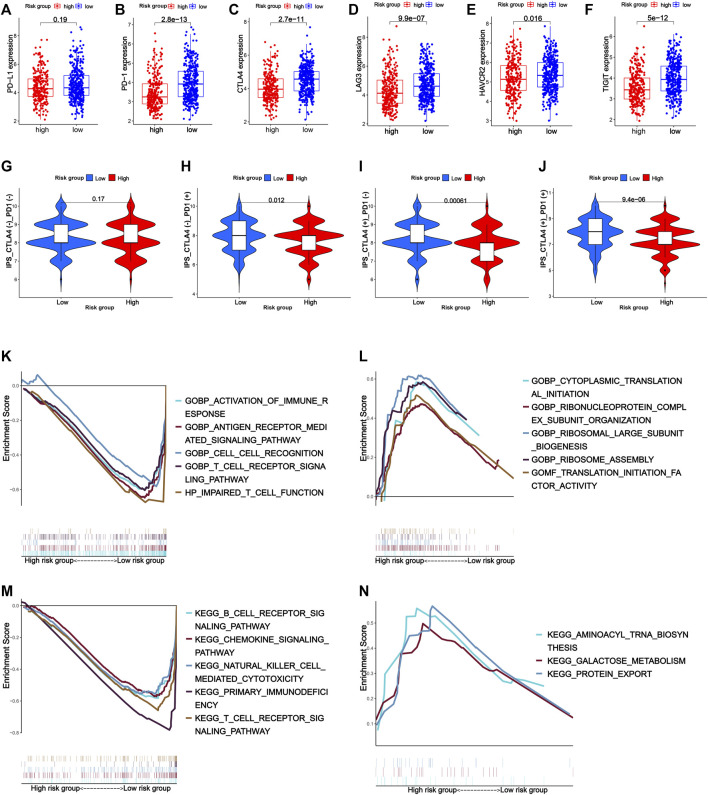
FIGURE 8.
Expression of immune inhibitor receptors such as PD-L1 (A), PD-1 (B), CTLA-4 (C), LAG3 (D), HAVCR2 (E), and TIGIT (F) between the high- and low-risk groups. (G–J) Response to immune checkpoint inhibitors of the high- and low-risk groups. (K–N) Gene set enrichment analysis. (K) Top five GO terms in the low-risk group. (L) Top five GO terms in the high-risk group. (M) Top five KEGG pathways in the low-risk group. (N) Top three KEGG pathways in the high-risk group.

