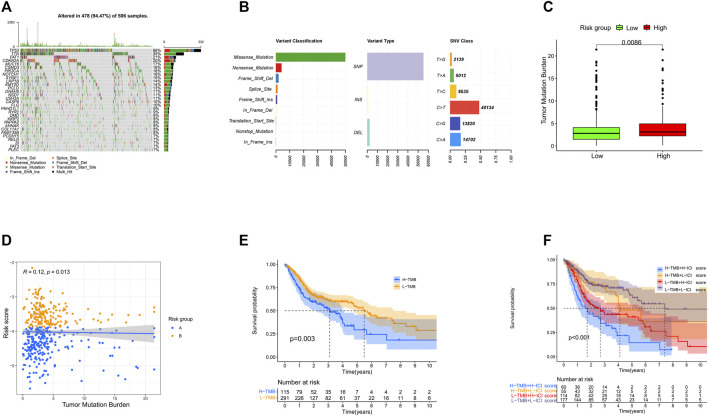
FIGURE 9.
Landscape of the mutations in HNSCC. (A) Distribution of mutation types among the top 30 genes. (B) Variant classifications, variant types, and SNV classes. (C) Levels of tumor mutation burden in high- and low-risk groups. (D) Correlation between the risk score and tumor mutation burden. (E) Survival analysis of tumor burden mutation. (F) Survival analysis of tumor mutation burden combined with the risk score.

