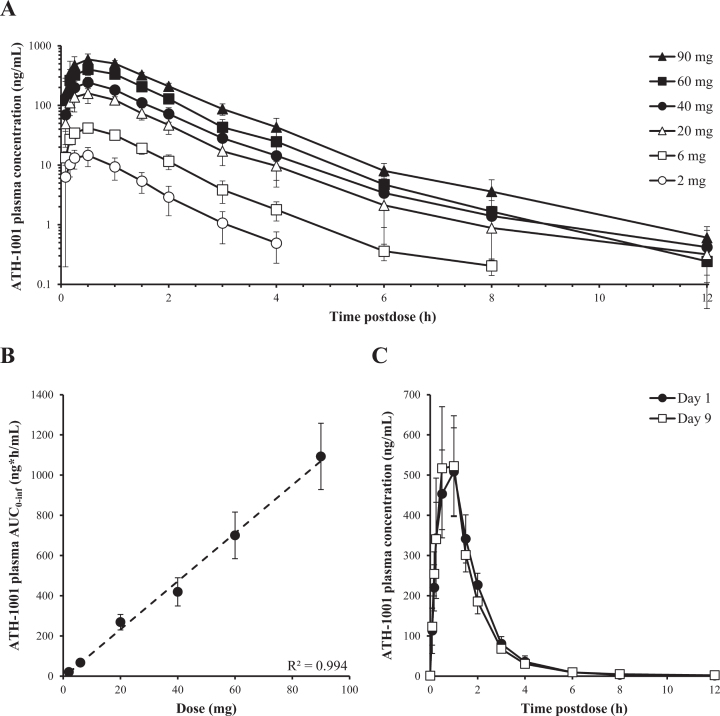
Fig. 3.
Pharmacokinetic profile of the active metabolite ATH-1001 after single and multiple once-daily SC doses of fosgonimeton. A) Plasma concentration of ATH-1001 in healthy young volunteers after single SC dose of 2 to 90 mg fosgonimeton (arithmetic mean±SD). B) Plasma AUC0 - inf of ATH-1001 in healthy young volunteers after a single SC dose of fosgonimeton demonstrated dose linearity (R2 = 0.994, arithmetic mean±SD). C) Plasma concentrations of ATH-1001 in healthy elderly volunteers on Day 1 (black circle) and Day 9 (open square) after once-daily SC injections of 60 mg fosgonimeton showed no appreciable accumulation and similar exposures between Day 1 and Day 9 (arithmetic mean±SD). AUC0 - inf, area under the plasma concentration-time curve from time zero to infinity; SC, subcutaneous; SD, standard deviation.

