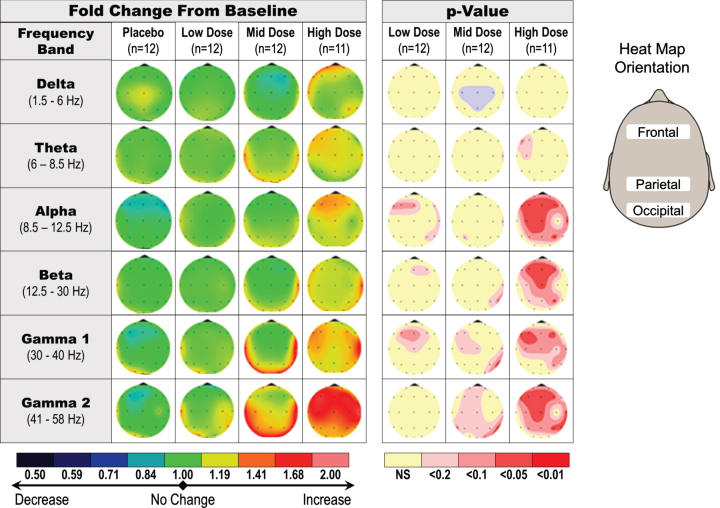
Fig. 4.
Dose-dependent increase in qEEG gamma induction in healthy young subjects receiving a single dose of fosgonimeton. SAD qEEG results illustrate the average change in absolute qEEG power from predose (baseline) to postdose, or the baseline ratio, for pooled placebo group, low doses (2 and 6 mg), middle doses (20 and 40 mg), and high doses (60 and 90 mg). Heat maps illustrate the average change in absolute qEEG power following administration of fosgonimeton (left) and associated p values from ANCOVA analysis (right; not corrected for multiple comparisons). ANCOVA, analysis of covariance; SAD, single ascending dose; qEEG, quantitative electroencephalogram.

