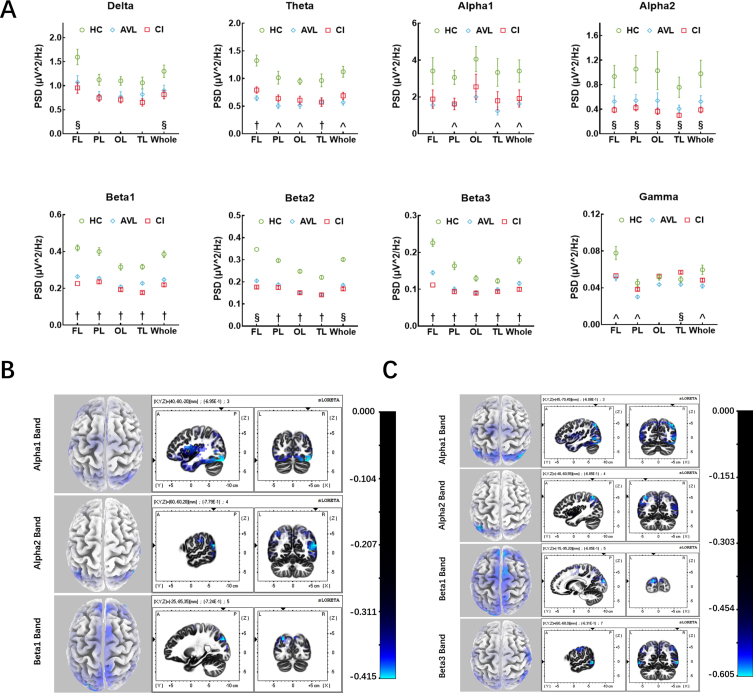
Fig. 2.
The results of EEG power and source localization. A) The EEG power results between three groups. Three kinds of results: (§) the significant difference of EEG power only between CI and HC groups; (∧) the significant difference of EEG power only between AVL and HC groups; (†) both CI and AVL groups showed significant difference of EEG power compared to HC group. (Error bars represent the standard errors of the means). PSD, power spectrum density; FL, frontal lobe; PL, parietal lobe; OL, occipital lobe; TL, temporal lobe. B) EEG source localization (sLORETA) activation maps between the AVL and the HC groups. Sources (blue area) superimposed on the average MRI images from the Montreal Neurological Institute (x-y-z coordinates of MRI images indicated on the figures). Alpha1 band showed decreased activity in V1, OTC, and cuneus. Alpha2 band showed reduced activity in IPS, STG, SPG, AG, OTC, and cuneus. While beta1 band showed decreased activity in cuneus, frontoparietal cortex, SPG, and pre-SMA. C) EEG source localization (sLORETA) activation maps between the CI and the HC groups. Sources (blue area) superimposed on the average MRI images from the Montreal Neurological Institute (x-y-z coordinates of MRI images indicated on the figures). Alpha1 band showed decreased activity in SPG, AG, OTC, and cuneus. Alpha2 band showed reduced activity in IPS, STG, SPG, AG, OTC, and cuneus. Beta1 band showed decreased activity in cuneus, and pre-SMA, while beta3 band showed reduced activity in MTG, OTC, cuneus, S3, and M1.

