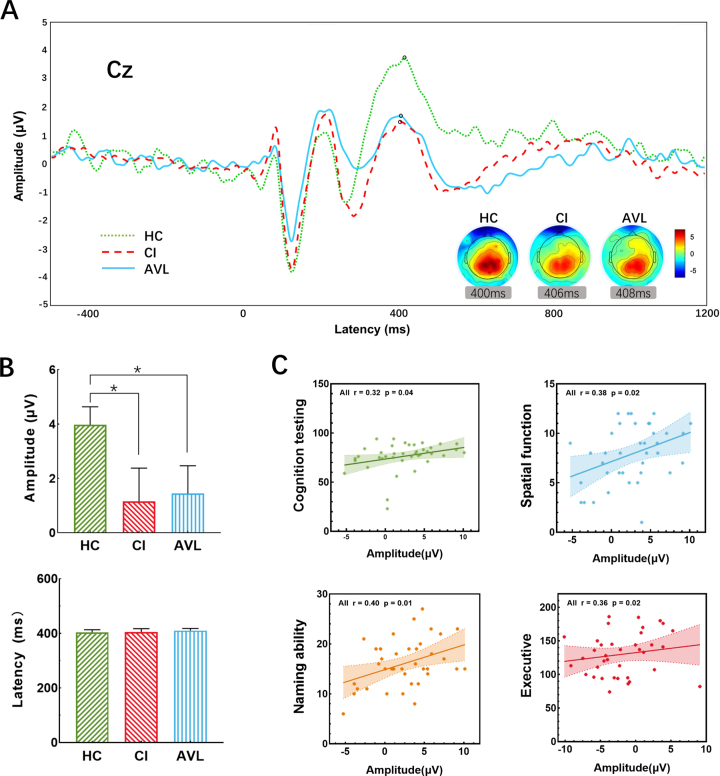
Fig. 4.
The P300 results at the electrode location Cz between threes groups. A) The grand-averaged P300 from scalp electrode Cz across three groups. A significant decrease in amplitude was between the CI and HC groups, and this decrease also existed between the AVL and HC groups. Topographic maps illustrate the distribution of the P300 effect, revealing clear midline parietal maxima in all groups. B) Histograms showed the amplitude (μV) and latency (ms) at Cz averaged across groups, there was no significant difference of latency between the three groups, while the amplitude of CI and AVL group was lower than HC group. (Error bars represent the standard errors of the means). C) The correlation of P300 amplitude and scores (if necessary, the score would be inverted) of different cognitive performances. X-axis showed the amplitude of P300; Y-axis showed the individual neuropsychological tests averaged to form 4 domains: Cognitive testing (MMSE, MoCA-B, and ACE-III), spatial function (CDT and JLO), naming ability (AFT and BNT), and executive function (SDMT, STT-A, and STT-B). Computed averages were related to the amplitude and plotted separately. The higher amplitude was significantly associated with better general cognitive, spatial, naming, and executive function.

