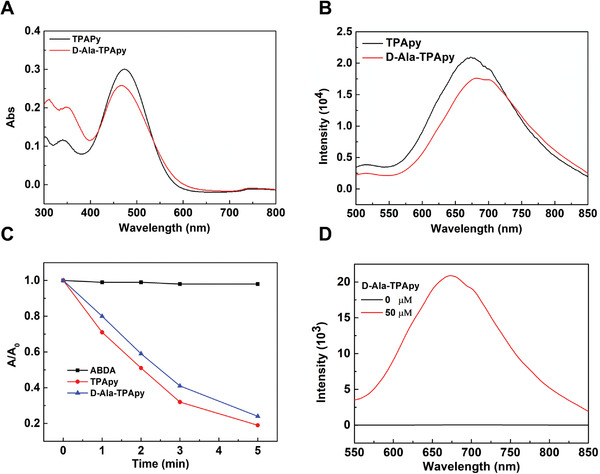
Figure 1.

a) UV–vis absorption and b) fluorescence emission spectra of TPApy and d‐Ala‐TPApy. c) Decomposition rates of ABDA induced by 1O2 generation from TPApy and d‐Ala‐TPApy ([TPApy] = [d‐Ala‐TPApy] = 10 × 10−6 m) in water. d) Fluorescence intensity of Clostridium butyricum before and after being incubated with the metabolic substrate (d‐Ala‐TPApy with the concentration of 0 and 50 × 10−6 m, respectively).
