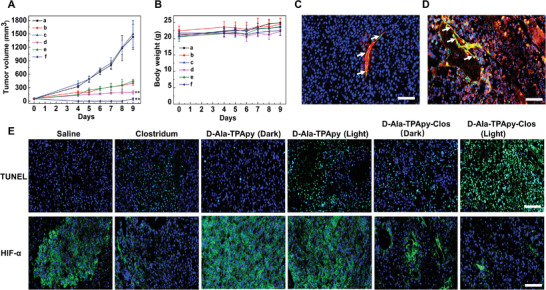
Figure 4.

In vivo antitumor study in B16F10 bearing C57BL/6 mice. a) Tumor volume change after administration of saline, b,c) d‐Ala‐TPApy with or without light (100 mW cm‐2, 5 min; 5 mg kg‐1, 40 µL), d) unmodified Clostridium, e,f) d‐Ala‐TPApy‐Clos (5 mg kg‐1 based on d‐Ala‐TPApy, 40 µL) with or without light (100 mW cm‐2, 5 min). The data presented here was mean ±SD, n = 7. The statistical significance level is ** p < 0.01. b) Bodyweight change analysis of tumor‐bearing mice. c,d) In vivo tumor penetration study after tumor‐bearing mice being injected d‐Ala‐TPApy (c) and d‐Ala‐TPApy‐Clos (d), respectively. The white arrow indicated blood vessels. Green: the blood vessel; Blue: DAPI stained nuclei; Red: the fluorescence of TPApy. e) Histological immunofluorescence in tumor sites labeled by TUNEL and HIF‐α. Green: apoptosis cells or HIF‐α. Blue: DAPI‐stained cell nuclei. Scale bar is 50 µm.
