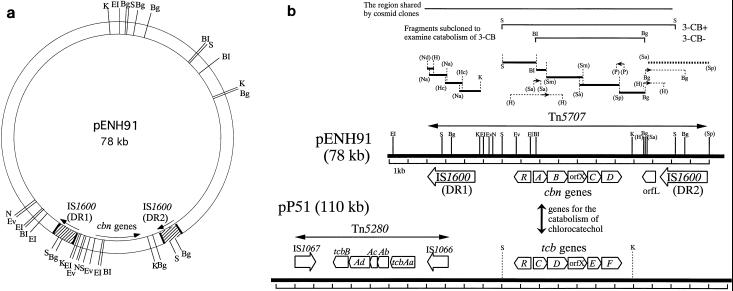
FIG. 1.
(a) Restriction map of pENH91. BI, BamHI; Bg, BglII; EI, EcoRI; Ev, EcoRV; K, KpnI; N, NheI; S, SacI. (b) Schematic representation of regions containing degradative genes and insertion sequences on plasmids pENH91 and pP51. The open arrows for the cbn genes, orfL, and the tcb genes show the locations and the directions of transcription of the ORFs. The orientation of the open arrows of IS1600, IS1066, and IS1067 are in agreement with the direction of transcription of the ORFs within the ISs. The strategies for subcloning and sequencing the catabolic region on plasmid pENH91 are shown above the linear map. Fragments shared by cosmid clones or subcloned to examine the 3-CB phenotype are shown by thin solid lines at the top of the figure. The thick solid lines above the map of pENH91 indicate DNA fragments that were sequenced in both directions by using nested sets of deletions or subcloned restriction fragments. The sequence indicated by the thick dotted line (a 3.3-kb SalI-SphI fragment) was reported previously (45) but was corrected in this study. The thin dotted lines with small arrows indicate subcloned fragments used to sequence the boundary sites between the sequenced fragments described above. The small arrows indicate the lengths and directions of the sequences determined (5′ to 3′). Restriction sites are abbreviated as follows, in addition to those defined in panel a: H, HindIII; Hc, HincII; Na, NaeI; Nd, NdeI; P, PstI; Sa, SalI; Sm, SmaI; and Sp, SphI. The restriction sites in parentheses are those determined only for subcloning of related fragments; thus, other sites recognized by such enzymes within the linear map were not determined before sequencing. The map of pP51 is based on material in references 62, 63, 65, and 66. Only the SacI and KpnI sites described in the text are shown for pP51.

