
Figure 2.
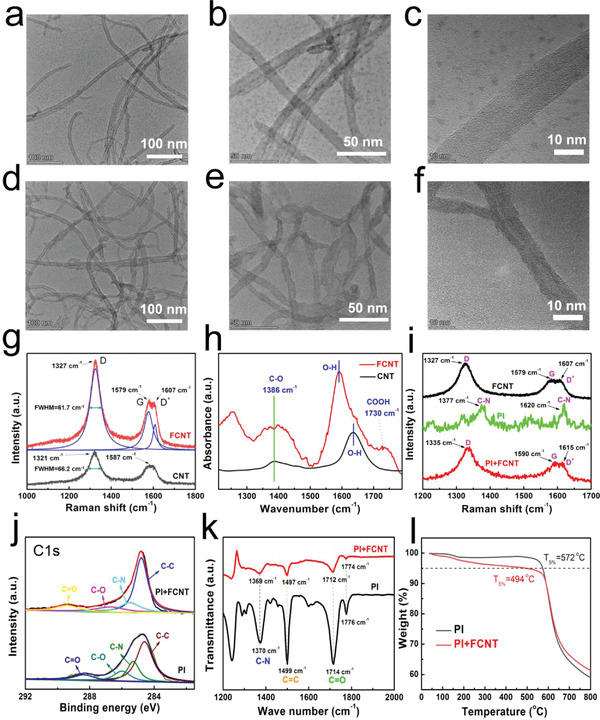
Characterization of CNT, FCNT, PI, and PI/FCNT(EPD). a–c) TEM images of CNTs. d–f) TEM images of FCNTs. g) Representative Raman spectra of CNT and FCNT. h) FT‐IR spectra of CNT and FCNT. i) Representative Raman spectra of PI, FCNT, and PI/FCNT(EPD). j) XPS survey (C1s) spectra of PI and PI/FCNT(EPD). k) FT‐IR spectra of PI and PI/FCNT (EPD). l) Thermogravimetric analysis curves of PI and PI/FCNT (EPD).