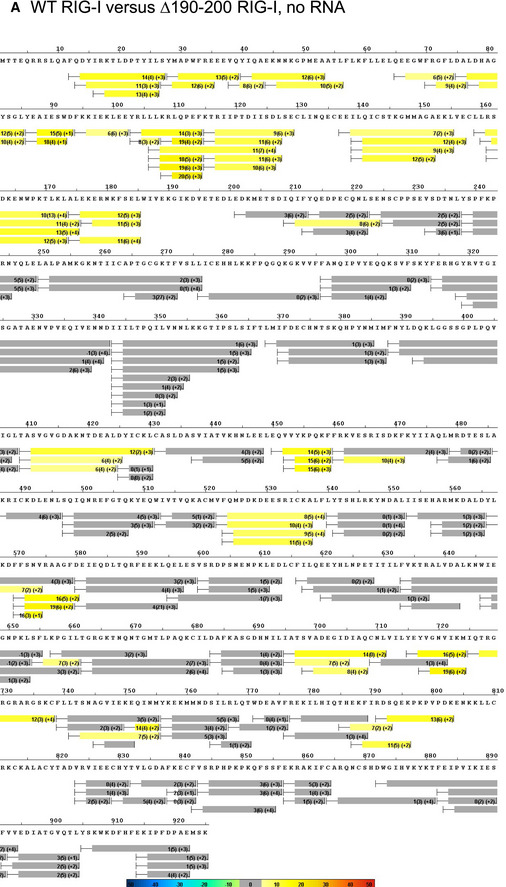
Figure EV2. Hydrogen–Deuterium Exchange Mass Spectroscopy (HDX) heatmap comparing WT RIG‐I and Δ190–200 RIG‐I.

The average ΔD2O% ± standard deviation between WT RIG‐I and Δ190–200 RIG‐I across all HDX time points. HDX Workbench colors each peptide according to the smooth color gradient HDX perturbation key shown in each indicated figure. Average ΔD2O% between −5% and 5% are considered non‐significant and are colored gray.
