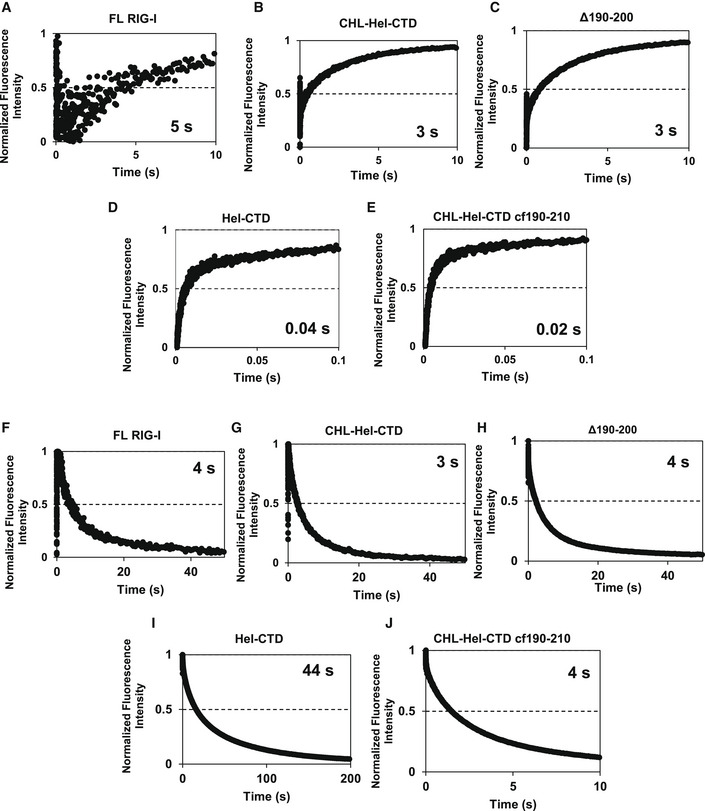
Figure EV4. Stopped‐flow kinetic traces of association and dissociation reactions of ds26 stem with various RIG‐I constructs.

-
A–EThumbprint graphs showing ds26 stem RNA association kinetics to various RIG‐I constructs. Each curve is an average of at least 6 individual traces (n = 6).
-
F–JThumbprint graphs showing ds26 stem RNA dissociation kinetics from various RIG‐I constructs. Numbers are the average association or dissociation times calculated from the amplitude and rate constants shown in Appendix Table S2 using Equation 3. Each curve is an average of at least six individual traces (n = 6).
