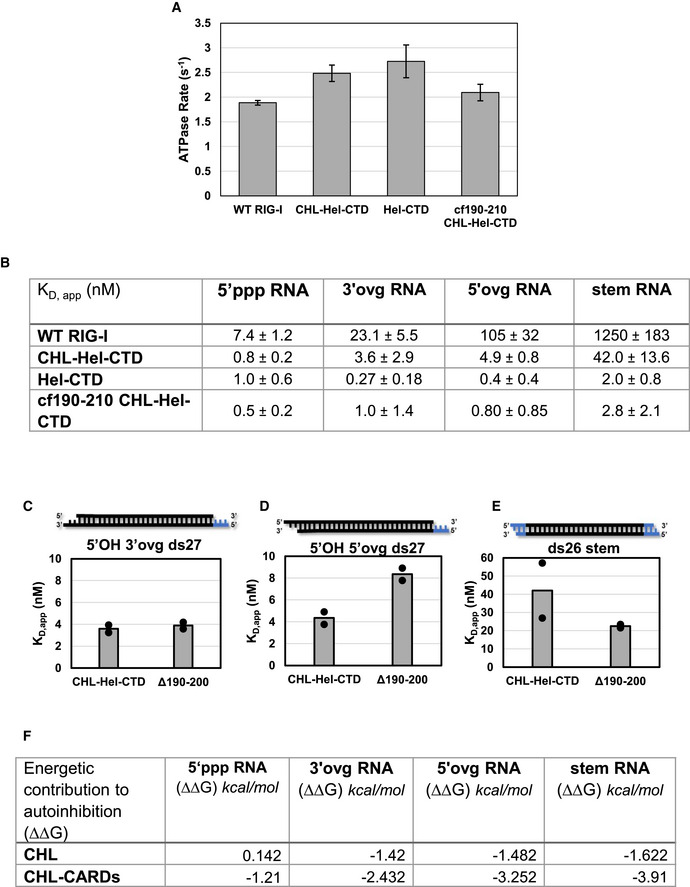
Figure EV5. RNA binding studies of RIG‐I constructs.

-
ABar chart comparing each protein construct’s ATPase Vmax tested simultaneously against either 5’ ppp ds27 from Fig 5 or No RNA. Note that no construct could hydrolyze ATP in the absence of bound RNA, typical of RIG‐I, and as such it is not shown. 10nM of protein was incubated with 100 nM of 5’ ppp ds27 RNA in all cases, and time course was performed with points taken at 0”, 30”, 60” and 90” (mechanical replicate, n = 3). Bars represent calculated Vmax values. Error bars represent standard error of fit.
-
BTable shows the RNA KD,app values shown as bars in Fig 5. Standard errors are the average standard errors of fit for two binding trials, each trial with mechanical replicates of n = 3.
-
C–EBar charts showing the KD,app of CHL‐Hel‐CTD and ∆190–200 RIG‐I from titrations measuring ATPase as a function of RNA concentration. RNA schematic: Black: RNA, blue: DNA. Bar represents the mean KD,app value of two independent RNA binding experiments, while dots indicate each independent RNA binding experiment. Each independent binding experiment had three time points (mechanical replicate, n = 3).
- F
