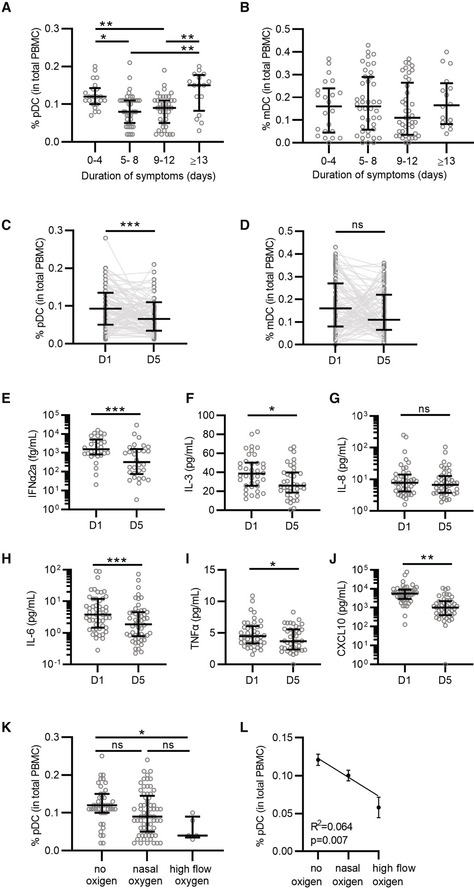
Figure 1. Infection with SARS‐CoV‐2 is associated with a decrease in plasmacytoid dendritic cells.

-
A, BPercentage of pDCs (A) and mDCs (B) from total PBMCs collected at D1 was quantified by flow cytometry and grouped to self‐reported duration of symptoms prior to D1 (A, B; 0–4 n = 22; 5–8 n = 39; 9–12 n = 39; ≥ 13 n = 16).
-
C, DPercentage of pDCs (C) and mDCs (D) at D1 and D5 matched samples from all patients independent of symptom duration (n = 93).
-
E–JMatched D1 and D5 plasma samples were available from 55 donors and protein levels were determined for IFNα2a (E, n = 30), IL‐3 (F, n = 38), IL‐8 (G, n = 44), IL‐6 (H, n = 51), TNFα (I, n = 42), and CXCL10 (J, n = 46), note that some samples could not be quantified and were excluded from the analysis.
-
K–LPercentage of pDCs grouped by COVID‐19 severity, as determined by oxygen supplementation (no oxygen n = 43, nasal oxygen n = 65, and high flow oxygen n = 5). Percentage of pDCs (K) was correlated to COVID‐19 disease severity (L) using simple linear regression.
Data information: Each dot represents a patient, lines with error bars show the median values with interquartile ranges (A–K) or mean values with the standard error of the mean (L). Statistical significance was determined using the Kruskal–Wallis test (A, B, K), Wilcoxon matched pairs signed rank test (C–J) and simple linear regression (L). *P < 0.05, **P < 0.01, ***P < 0.001, ns = not significant.
