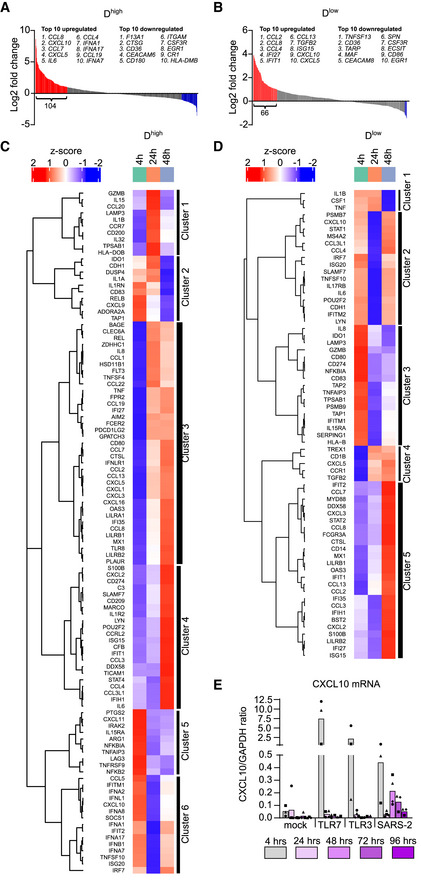
Figure 3. Nature and timing of SARS‐CoV‐2‐induced gene expression changes in pDCs.

-
A, BWaterfall plots illustrating gene expression changes in pDCs 48 h post SARS‐CoV‐2 exposure, relative to mock‐treated cells, from two donors; Dhigh (A) and Dlow (B), indicating genes with > 2 fold change in red (upregulated) and blue (downregulated).
-
C, DHeat maps and unsupervised hierarchical cluster analyses of the > 2‐fold upregulated genes in Dhigh (C) and Dlow (D).
-
ETo validate the wave pattern of gene expression, CXCL10 mRNA was quantified using RT‐qPCR in multiple pDC donors (n = 3–4) at different time points post TLR7 agonist R837, TLR3 agonist poly(I:C), and SARS‐CoV‐2 (1 MOI) exposure at indicated time points.
Data information: Bars represent mean values and equal symbols represent equal donors.
