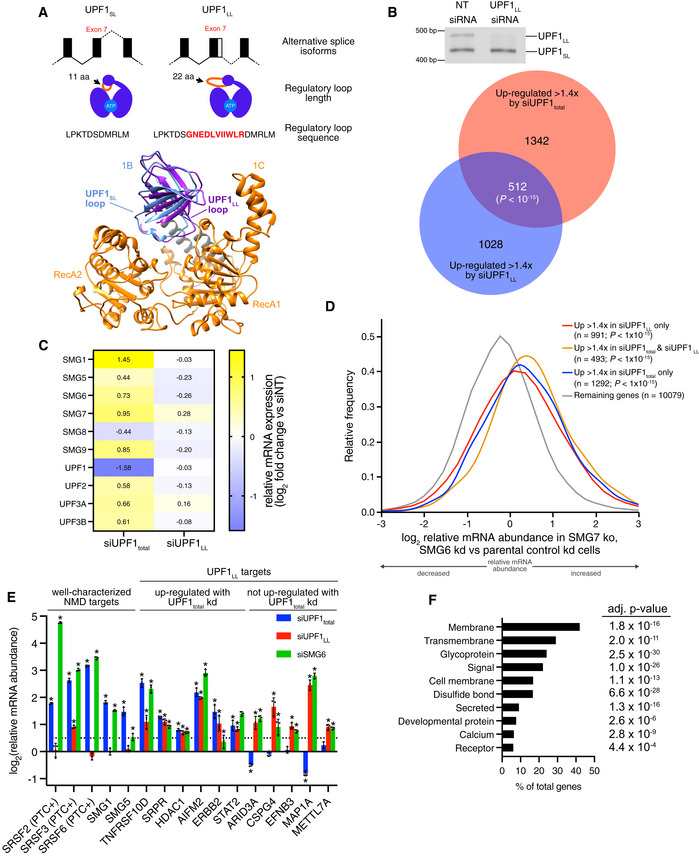
Figure 1. Alternative UPF1LL splice isoform contributes to NMD under normal cellular conditions.

- (Top) Schematic representation of alternative 5' splice site usage in exon 7 of mammalian UPF1 that results in two UPF1 protein isoforms that differ in length of the regulatory loop within the helicase core. (Bottom) Ribbon diagram of human UPF1SL helicase core overlaid with that of human UPF1LL. The regulatory loop in domain 1B is indicated for UPF1SL (light blue) and UPF1LL (purple), based on Protein Data Bank accessions 2XZP and 6EJ5 (Chakrabarti et al, 2011; Gowravaram et al, 2018).
- (Top) Semiquantitative RT–PCR of UPF1SL or UPF1LL transcript levels following transfection of HEK‐293 cells with a NT siRNA or a siRNA that specifically targets the UPF1LL isoform. (Bottom) Venn diagram (to scale) of overlapping targets identified from RNA‐seq following total UPF1 or UPF1LL‐specific knockdown. Depicted are genes that increased in abundance at least 1.4‐fold (FDR < 0.05) and met read count cutoffs in both datasets. P‐value indicates enrichment of genes that increased in abundance at least 1.4‐fold (FDR < 0.05) with UPF1LL‐specific knockdown among those regulated by total UPF1, as determined by Fisher's exact test.
- Heat map of changes in relative mRNA abundance for genes encoding NMD factors, as determined from RNA‐seq following transfection of HEK‐293 cells with a siRNA that targets both UPF1 isoforms (UPF1total) or a siRNA that specifically targets the UPF1LL isoform.
- Density plot of changes in relative mRNA abundance as determined by RNA‐seq in SMG7ko/SMG6kd cells, relative to a parental cell line treated with control siRNAs (Boehm et al, 2021). Genes were categorized as up‐regulated by siUPF1total only, siUPF1LL only, or both siUPF1total and siUPF1LL. Statistical significance was determined by K–W test, with Dunn’s correction for multiple comparisons.
- RT–qPCR analysis of indicated transcripts following transfection of HEK‐293 cells with the indicated siRNAs. Relative fold changes are in reference to NT siRNA. Asterisk (*) indicates P < 0.05, as determined by two‐way ANOVA. Black dots represent individual data points and error bars indicate mean ± SD (n = 3 biological replicates). Dashed line indicates log2(fold change) of +0.5. PTC+ indicates the use of primers specific to transcript isoforms with validated poison exons (Lareau et al, 2007; Ni et al, 2007). See also Dataset EV3 for P‐values associated with each statistical comparison.
- Gene ontology analysis of 1621 genes that increased in expression at least 1.4‐fold upon UPF1LL‐specific knockdown in HEK‐293 cells under normal cellular conditions. Genes may map to multiple categories.
Source data are available online for this figure.
