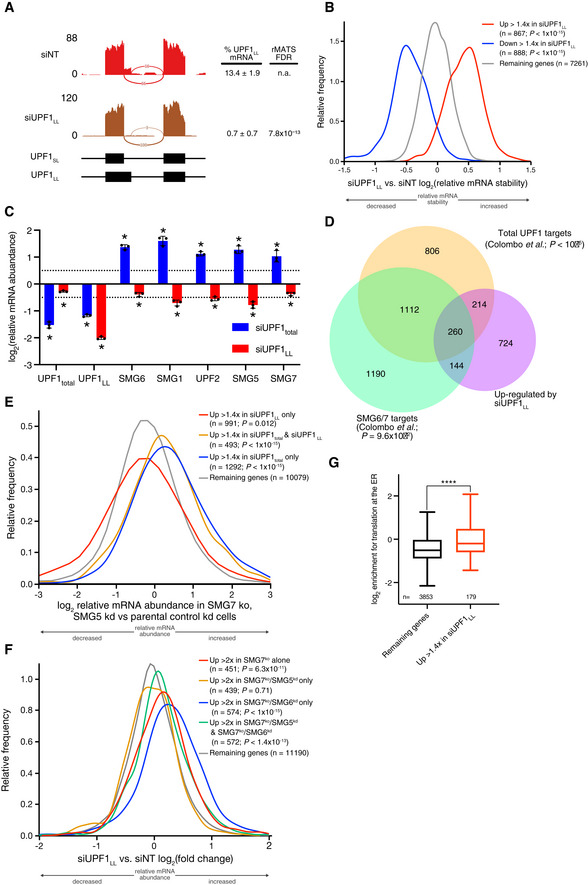
Figure EV1. UPF1LL has distinct effects on NMD autoregulation and factor requirements.

- Sashimi plot from representative RNA‐seq samples of siNT and siUPF1LL knockdown cells. Percent spliced in values and FDR were calculated with rMATS software (Shen et al, 2014).
- Density plot of changes in mRNA stability as determined by REMBRANDTS analysis of RNA‐seq following isoform‐specific UPF1LL depletion (Alkallas et al, 2017). mRNAs were binned according to up‐ or down‐regulation in response to siUPF1LL. Statistical significance was determined by K–W test, with Dunn's correction for multiple comparisons.
- RT–qPCR analysis of indicated transcripts following transfection of HEK‐293 cells with siRNAs that target both UPF1 isoform (UPF1total) and the UPF1LL isoform. Relative fold changes are in reference to NT siRNA. siUPF1total or siUPF1LL was compared to the NT siRNA control for significance testing. Asterisk (*) indicates P < 0.05, as determined by two‐way ANOVA. Black dots represent individual data points and error bars indicate mean ± SD (n = 3 biological replicates). Dashed lines indicate log2 (fold change) of ± 0.5. See also Dataset EV3 for P‐values associated with each statistical comparison.
- Venn diagram (to scale) of overlapping targets identified from RNA‐seq following UPF1LL knockdown (this dataset), total UPF1 knockdown, or SMG6/7 double knockdown and rescue (Colombo et al, 2017). Depicted are genes that increased in abundance at least 1.4‐fold (FDR < 0.05) with UPF1LL‐specific knockdown and their overlap with genes that increased in abundance (FDR < 0.05) with total UPF1 knockdown or genes that increased in abundance with SMG6/7 double knockdown and were significantly rescued by expression of SMG6 or SMG7 (SMG6/7 targets). P‐values indicate enrichment of genes that increased in abundance at least 1.4‐fold (FDR < 0.05) with UPF1LL‐specific knockdown among those regulated by total UPF1 and SMG6/7, as determined by Fisher's exact test. Only genes that met read count cutoffs in all conditions were included in the analysis.
- Density plot of changes in relative mRNA abundance as determined by RNA‐seq in SMG7ko/SMG5kd cells, relative to a parental cell line treated with control siRNAs (Boehm et al, 2021). Genes were categorized as up‐regulated by siUPF1total only, siUPF1LL only, or both siUPF1total and siUPF1LL. Statistical significance was determined by K–W test, with Dunn’s correction for multiple comparisons.
- Density plot of changes in relative mRNA abundance as determined by RNA‐seq following UPF1LL knockdown in HEK‐293 cells. Genes were categorized as up‐regulated by SMG7ko, SMG7ko/SMG5kd, SMG7ko/SMG6kd, or SMG7ko/SMG5kd and SMG7ko/SMG6kd (Boehm et al, 2021). Statistical significance was determined by K–W test, with Dunn’s correction for multiple comparisons.
- Box plot of log2 enrichment for translation at the ER (Jan et al, 2014). mRNAs were binned by sensitivity to UPF1LL‐specific knockdown in HEK‐293 cells. Statistical significance was determined by K–S test (****P = 1 × 10⁻⁶). Boxes indicate interquartile ranges, horizontal lines represent medians, and bars indicate Tukey whiskers.
Source data are available online for this figure.
