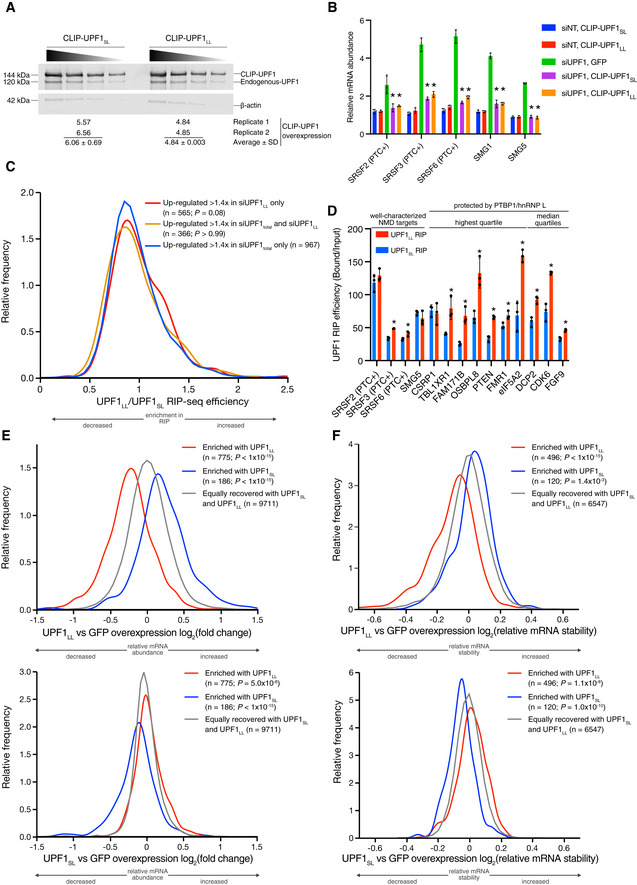
Figure EV2. NMD protection can be overcome by UPF1LL .

- Western blots of CLIP‐UPF1SL and CLIP‐UPF1LL overexpression. Membranes were probed with an anti‐UPF1 antibody that detects both endogenous and CLIP‐tagged UPF1. Wedge indicates serial twofold dilutions of lysate. Mean (± SD) of CLIP‐UPF1 overexpression was determined from two replicate membranes.
- RT–qPCR analysis of well‐characterized NMD targets following total UPF1 knockdown and rescue with siRNA‐resistant CLIP‐tagged UPF1. Relative fold changes are in reference to the GFP‐expressing control line treated with a NT siRNA. Significance of NMD rescue by CLIP‐UPF1 was compared to the GFP‐expressing control line treated with total UPF1 siRNA. Asterisk (*) indicates P < 0.0001, as determined by two‐way ANOVA with multiple comparisons. Black dots represent individual data points and error bars indicate mean ± SD (n = 3 biological replicates). PTC+ indicates the use of primers specific to transcript isoforms with validated poison exons (Lareau et al, 2007; Ni et al, 2007). See also Dataset EV3 for P‐values associated with each statistical comparison.
- Density plot of recovered mRNAs in CLIP‐UPF1LL affinity purifications relative to that of CLIP‐UPF1SL. Genes were categorized as up‐regulated by siUPF1total only, siUPF1LL only, or both siUPF1total and siUPF1LL. Statistical significance was determined by K–W test, with Dunn’s correction for multiple comparisons.
- RT–qPCR analysis of indicated transcripts from UPF1 RIP‐seq experiments. Relative fold enrichment was determined by dividing the recovered mRNA by its corresponding input amount. Significance of differential recovery in CLIP‐UPF1LL RIP was determined by comparison to that in CLIP‐UPF1SL. Asterisk (*) indicates P < 0.05, as determined by unpaired Student’s t‐test. Black dots represent individual data points, and error bars indicate mean ± SD (n = 3 biological replicates). For protected mRNAs, the PTBP1/hnRNP L motif density bin of the 3'UTR is indicated. PTC+ indicates the use of primers specific to transcript isoforms with validated poison exons (Lareau et al, 2007; Ni et al, 2007). See also Dataset EV3 for P‐values associated with each statistical comparison.
- Density plots of changes in relative mRNA abundance as determined by RNA‐seq following UPF1LL (top) or UPF1SL (bottom) overexpression. mRNAs were binned according to enrichment in the CLIP‐UPF1LL or CLIP‐UPF1SL affinity purifications. Statistical significance was determined by K–W test, with Dunn’s correction for multiple comparisons.
- Density plots of changes in mRNA stability as determined by REMBRANDTS analysis of RNA‐seq following UPF1LL (top) or UPF1SL (bottom) overexpression. mRNAs were binned according to enrichment in the CLIP‐UPF1LL or CLIP‐UPF1SL affinity purifications. Statistical significance was determined by K–W test, with Dunn’s correction for multiple comparisons.
Source data are available online for this figure.
