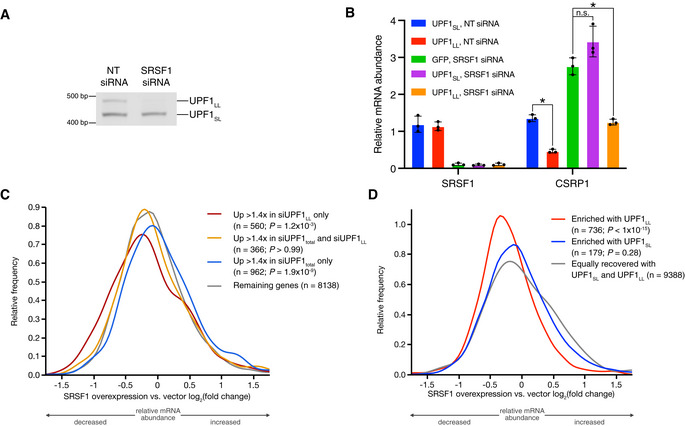
Figure 3. Splicing regulator SRSF1 is required for UPF1LL expression.

- Semiquantitative RT–PCR of UPF1SL or UPF1LL transcript levels following transfection of HEK‐293 cells with the indicated siRNAs.
- RT–qPCR analysis of indicated transcripts following transfection of a NT siRNA or SRSF1‐specific siRNA under conditions of CLIP‐UPF1SL or CLIP‐UPF1LL overexpression. Relative fold changes are in reference to the GFP‐expressing control line treated with a NT siRNA. Asterisk (*) indicates P < 0.05, as determined by unpaired Student’s t‐test. Black dots represent individual data points and error bars indicate mean ± SD (n = 3 biological replicates). See also Dataset EV3 for P values associated with each statistical comparison.
- Density plot of changes in relative mRNA abundance as determined by RNA‐seq following SRSF1 overexpression (Data ref: Caputi et al, 2019). Genes were categorized as up‐regulated by siUPF1total only, siUPF1LL only, or both siUPF1total and siUPF1LL. Statistical significance was determined by K–W test, with Dunn’s correction for multiple comparisons.
- Density plot as in (C), with genes binned according to enrichment in the CLIP‐UPF1LL or CLIP‐UPF1SL affinity purifications.
Source data are available online for this figure.
