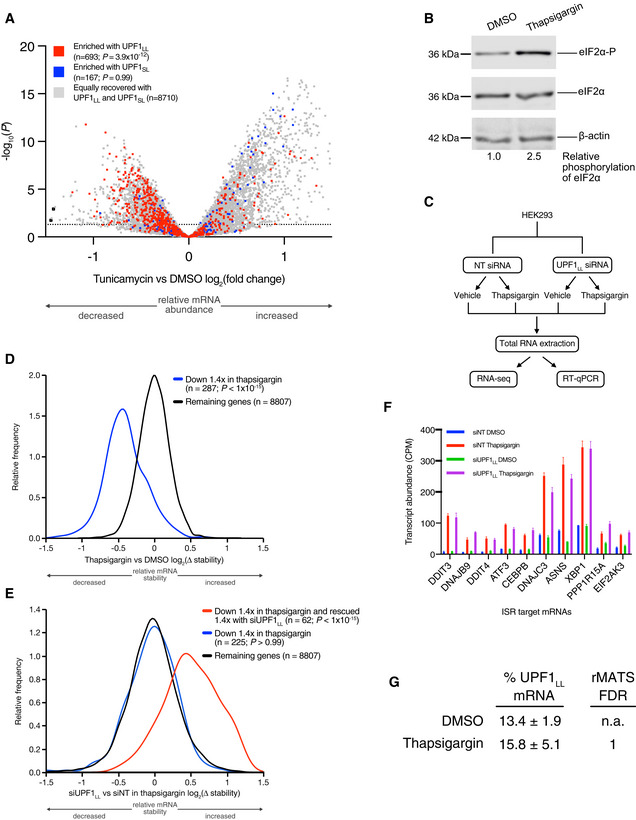
Figure EV3. Transcripts targeted by UPF1LL are coordinately down‐regulated during ER stress and induction of the ISR.

- Volcano plot of relative mRNA abundance as determined from RNA‐seq following treatment of HEK‐293 cells with 1 µM tunicamycin for 6 h (Data ref: Park et al, 2017). mRNAs were binned by RIP‐seq efficiency in CLIP‐UPF1LL or CLIP‐UPF1SL affinity purifications. Statistical significance was determined by K–W test, with Dunn's correction for multiple comparisons. Dashed line indicates the significance threshold P ≤ 0.05 (n = 3 biological replicates).
- Western blot of eIF2α phosphorylation following treatment of HEK‐293 cells with 1 µM thapsigargin for 6 h.
- Schematic of the RNA‐seq experimental workflow and conditions for UPF1LL knockdown and thapsigargin treatment.
- Density plot of relative mRNA stability as determined by REMBRANDTS analysis of RNA‐seq following treatment of HEK‐293 cells with 1 µM thapsigargin for 6 h. mRNAs were binned by changes in relative mRNA abundance in thapsigargin. Statistical significance was determined by K–S test.
- Density plot of relative mRNA stability as determined by REMBRANDTS analysis of RNA‐seq following UPF1LL knockdown in HEK‐293 cells and treatment with 1 µM thapsigargin for 6 h (Alkallas et al, 2017). mRNAs were binned by changes in relative mRNA abundance in thapsigargin with UPF1LL knockdown. Statistical significance was determined by K–W test, with Dunn's correction for multiple comparisons.
- Quantification of characterized ISR‐target transcript abundance in RNA‐seq of the indicated conditions. Error bars indicate mean ± SD (n = 3 biological replicates).
- Quantification of UPF1LL isoform expression in control and thapsigargin‐treated HEK‐293 cells from rMATS analyses (n = 3 biological replicates).
Source data are available online for this figure.
