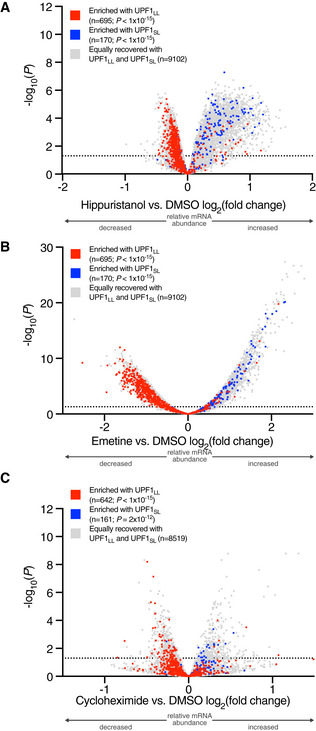
Figure EV4. UPF1LL targets decrease in abundance with translational inhibition.

- Volcano plot of relative mRNA abundance as determined from RNA‐seq following treatment of MCF7 cells with 150 nM hippuristanol for 1 h (Data ref: Waldron et al, 2019). mRNAs were binned by RIP‐seq efficiency in CLIP‐UPF1LL or CLIP‐UPF1SL affinity purifications. Statistical significance was determined by K–W test, with Dunn's correction for multiple comparisons. Dashed line indicates the significance threshold P ≤ 0.05 (n = 3 biological replicates).
- Volcano plot as in (A), following treatment of HEK‐293 cells with 50 ng/ml emetine for 4 h (Martinez‐Nunez et al, 2017). Dashed line indicates the significance threshold P ≤ 0.05 (n = 3 biological replicates).
- Volcano plot as in (A), following treatment of HeLa cells with 100 µg/ml cycloheximide for 15 min (Data ref: Kearse et al, 2019). Dashed line indicates the significance threshold P ≤ 0.05 (n = 3 biological replicates).
