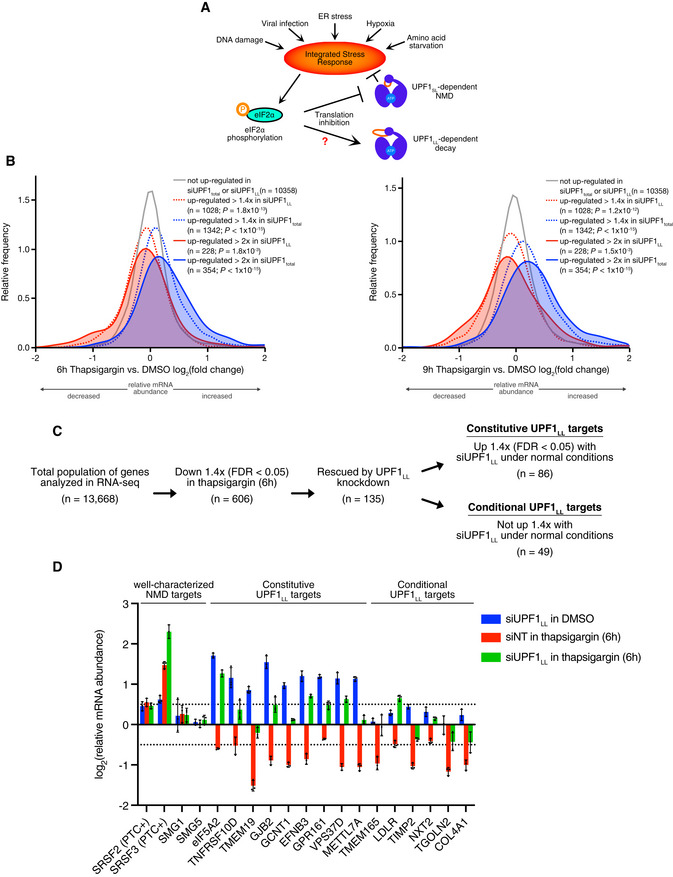
Figure 5. UPF1LL conditionally remodels NMD target selection during ER stress and induction of the ISR.

- Scheme for activation of the integrated stress response (ISR) and effects on UPF1‐dependent decay.
- Density plots of changes in relative mRNA abundance as determined by RNA‐seq following treatment of HEK‐293 cells with 1 µM thapsigargin for 6 h (left) or 9 h (right). Genes were categorized as up‐regulated by siUPF1total only or siUPF1LL only under basal conditions. Statistical significance was determined by K–W test, with Dunn’s correction for multiple comparisons.
- RNA‐seq analysis of HEK‐293 cells identifies populations of genes that decreased in abundance with thapsigargin treatment and were rescued by UPF1LL‐specific knockdown. Indicated are genes that increased in abundance at least 1.4‐fold (FDR < 0.05) with UPF1LL‐specific knockdown under normal conditions.
- RT–qPCR analysis of indicated transcripts following transfection of HEK‐293 cells with indicated siRNAs and treatment with 1 µM thapsigargin for 6 h. Relative fold changes are in reference to vehicle‐treated, NT siRNA. Black dots represent individual data points and error bars indicate mean ± SD (n = 3 biological replicates). Dashed lines indicate log2 (fold change) of ± 0.5. PTC+ indicates the use of primers specific to transcript isoforms with validated poison exons (Lareau et al, 2007; Ni et al, 2007). See also Dataset EV3 for P‐values associated with each statistical comparison.
Source data are available online for this figure.
