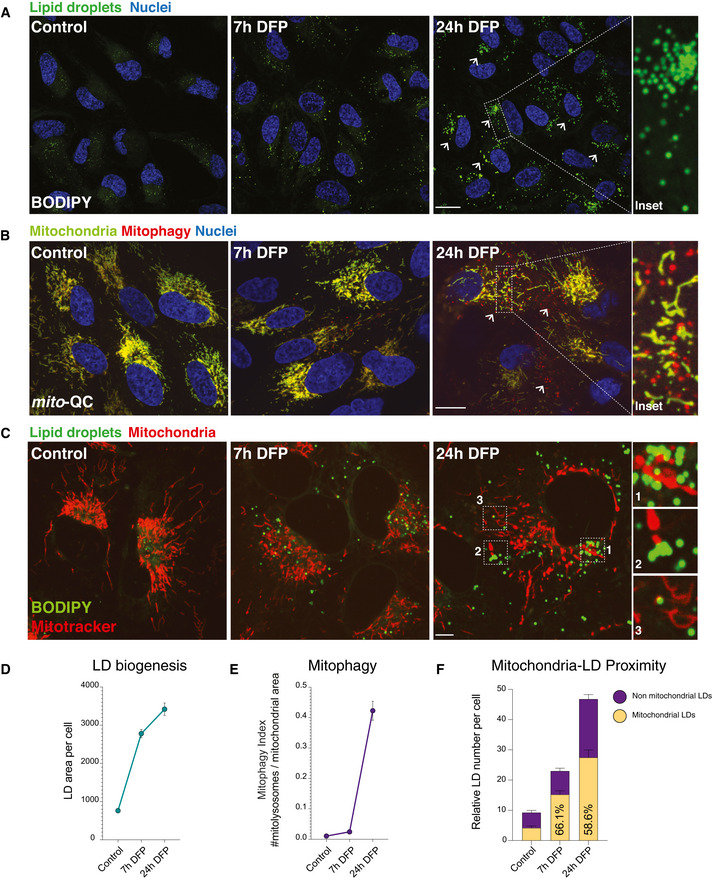
Figure 3. Lipid droplet biogenesis precedes the onset of mitophagy.

- Lipid droplet time course. Representative photomicrographs showing lipid droplet abundance in ARPE19 cells treated with DFP starting at 7 h and maximal at 24 h. Neutral lipids were revealed by BODIPY 493/503. Nuclei are counterstained with Hoescht 33342. Inset shows detail of LDs in a cell treated with DFP for 24 h. Arrows highlight LD accumulation. Scale bars = 5 μm.
- Mitophagy time course. Representative photomicrographs showing time course of DFP treatment in mitophagy reporter cells (human ARPE19 cells with stable expression of mito‐QC). Mitochondrial networks are visible in yellow and mitolysosomes as red‐only puncta signifying mitophagy. Nuclei are counterstained with Hoescht 33342. Mitophagy appears maximal after 24 h of DFP treatment, with little difference between control and 7 h conditions. Inset shows details of mitolysosomes within the mitochondrial network of a highly mitophagic cell following DFP treatment. Arrows highlight mitolysosomes. Scale bar = 5 μm.
- Lipid droplets accumulate at mitochondria when cells are treated with DFP. Representative photomicrographs showing lipid droplet and mitochondria in ARPE19 cells treated with DFP at 7 h and at 24 h. Neutral lipids were revealed by BODIPY 493/503 and mitochondria by Mitotracker. Nuclei are counterstained with Hoescht 33342. Inset shows detail of LDs in close proximity to mitochondria in cells treated with DFP for 24 h. Scale bar = 5 μm.
- Quantification of lipid droplet area per cell over time. Lipid droplet area was quantified per cell area using a pipeline generated in CellProfiler. n = 3 with at least 50 cells quantified per biological replicate for each condition. Data represent means ± SEM.
- Quantification of mitophagy over time. Mitophagy index per cell is measured as a ratio of the number of mitolysosomes per mitochondrial content. n = 3 with at least 50 cells quantified per biological replicate for each condition. Data represent means ± SEM.
- Quantification of lipid droplet and mitochondria proximity over time. n = 3 with at least 50 cells quantified per biological replicate for each condition. Ratios between control and 24 h DFP; P < 0.05.
