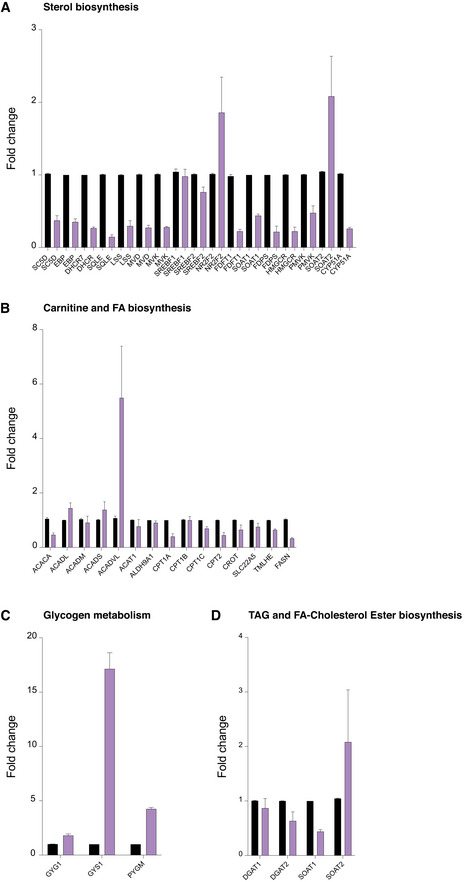
Figure EV3. Gene expression analysis by RT‐qPCR upon iron depletion.

- Gene expression analysis by TaqMan RT‐qPCR of mRNA transcripts encoding regulatory enzymes in carnitine and fatty acid biosynthesis in control and 24‐h DFP (1 mM)‐treated cells.
- Gene expression analysis by TaqMan RT‐qPCR of mRNA transcripts encoding regulatory enzymes in sterol biosynthesis in control and 24‐h DFP (1 mM)‐treated cells.
- Gene expression analysis by TaqMan RT‐qPCR of mRNA transcripts encoding regulatory enzymes in glycogen biosynthesis in control and 24‐h DFP (1 mM)‐treated cells.
- Gene expression analysis by TaqMan RT‐qPCR of mRNA transcripts encoding regulatory enzymes in triglyceride and fatty acid‐cholesterol ester biosynthesis in control and 24‐h DFP (1 mM)‐treated cells.
