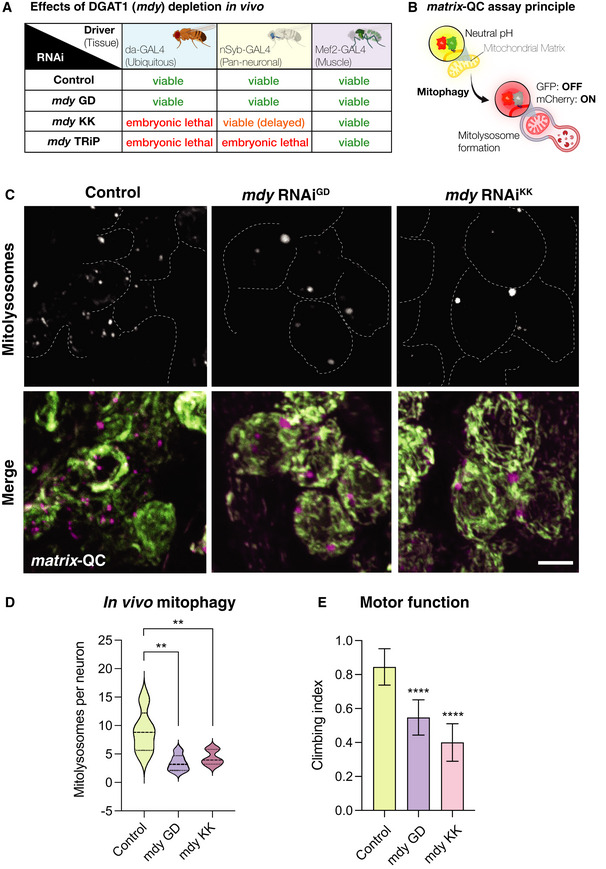
Phenotypic assessment of DGAT1/mdy knockdown by different RNAi transgenes by GAL4 drivers ubiquitously or in a tissue‐specific manner.
Schematic for the matrix‐QC mitophagy reporter system. mCherry‐GFP is targeted to the mitochondrial matrix via the specific COXVIII targeting sequence. As for mito‐QC, the cytosolic mitochondrial network appears in yellow, due to red–green fluorescence. Upon mitophagy, mitochondria delivered to endolysosomes are distinguished by mCherry‐only puncta, whereas GFP does not fluoresce in the acidic microenvironment.
Representative photomicrographs of larval neuronal cell bodies expressing the matrix‐QC reporter and RNAi for mdy or control driven with nSyb‐GAL4. GFP is shown in green, mCherry is shown in magenta. Mitolysosomes (mCherry‐only puncta) are shown in greyscale. Scale bar = 5 μm.
Quantitative analysis of mitophagy (mitolysosome per neuronal cell body). Data are shown as violin plot with median (dashed line) and quartile range (dotted lines); n = 5–6 animals, with 23–40 cells per animal. One‐way ANOVA with Šidák’s post‐test correction for multiple samples; **P < 0.01.
Analysis of locomotor behaviour (climbing) in animals with neuron‐specific (nSyb‐GAL4) knockdown of mdy or control. Bars show mean ± 95% CI; n = 40, 57 and 45 animals, respectively. Kruskal–Wallis test with Dunn’s post‐hoc correction; ****P < 0.0001.

