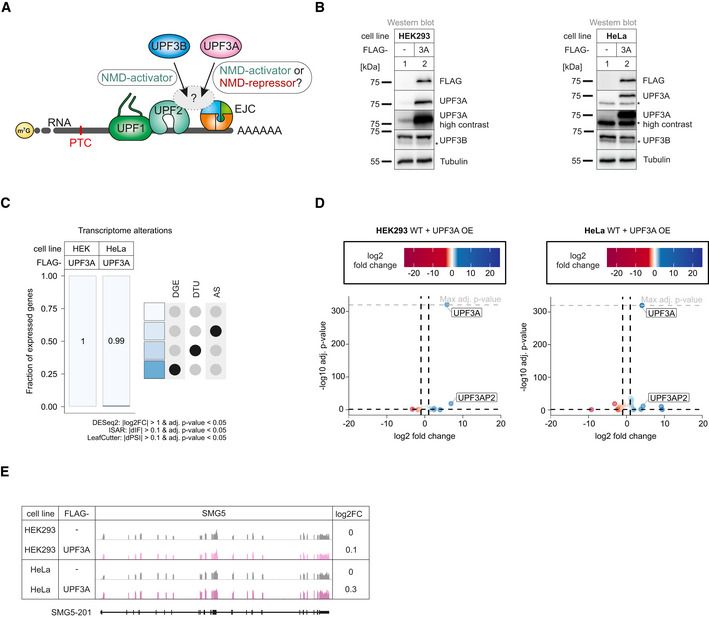
Figure 1. UPF3A overexpression does not affect NMD.

- Schematic representation of the bridge between UPF1 and the EJC during NMD. Binding of UPF3A instead of the stronger bound UPF3B is discussed to either activate or repress NMD.
- Western blot analyses after induced expression of FLAG‐tagged UPF3A in WT HEK293 and HeLa cells (n = 1). Tubulin serves as control. The asterisk indicates unspecific bands.
- Fraction of expressed genes (genes with non‐zero counts in DESeq2) were calculated which exhibit individual or combinations of differential gene expression (DGE), differential transcript usage (DTU), and/or alternative splicing (AS) events in HEK293 and HeLa WT cells overexpressing UPF3A using the respective computational analysis (cutoffs are indicated). AS and DTU events were collapsed on the gene level. For DGE, P‐values were calculated by DESeq2 using a two‐sided Wald test and corrected for multiple testing using the Benjamini–Hochberg method. For DTU, P‐values were calculated by IsoformSwitchAnalyzeR (ISAR) using a DEXSeq‐based test and corrected for multiple testing using the Benjamini–Hochberg method. For AS, P‐values were calculated by LeafCutter using an asymptotic chi‐squared distribution and corrected for multiple testing using the Benjamini–Hochberg method.
- Volcano plot showing the differential gene expression analyses from the RNA‐Seq dataset of HEK293 and HeLa WT cells overexpressing UPF3A. The log2 fold change is plotted against the ‐log10 adjusted P‐value (P adj). P‐values were calculated by DESeq2 using a two‐sided Wald test and corrected for multiple testing using the Benjamini–Hochberg method. OE = overexpression.
- Read coverage of SMG5 from WT HEK293 and HeLa RNA‐seq data with or without induced UPF3A overexpression shown as Integrative Genomics Viewer (IGV) snapshot. Differential gene expression (from DESeq2) is indicated as log2 fold change (log2FC) on the right. Schematic representation of the protein coding transcript below.
Source data are available online for this figure.
