
Figure EV1. UPF3A overexpression does not cause upregulation of NMD‐targets.
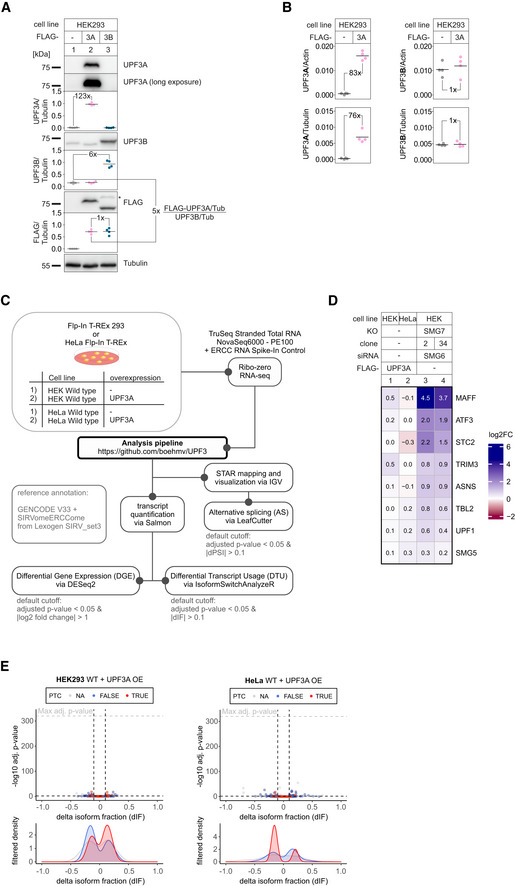
- Western blot analysis of unaltered HEK293 WT cells or with induced FLAG‐UPF3A or FLAG‐UPF3B expression. UPF3A, UPF3B, and FLAG levels were detected. Tubulin serves as control. Protein levels were quantified, normalized to tubulin expression, and shown as datapoints and mean (n = 4). Fold‐changes of relevant conditions are shown.
- Skyline analysis of WT and UPF3A‐overexpressing cells after whole proteome mass spec analysis. Quantifier intensities of UPF3A (left) and UPF3B (right) were normalized to actin (top) and tubulin (bottom) which were used as “loading controls”. Results are shown as datapoints and mean (n = 4). The means were used to calculate the respective fold‐changes.
- Schematic overview of the analysis pipeline.
- Volcano plot showing the differential transcript usage (via IsoformSwitchAnalyzeR) in RNA‐Seq data of HEK293 and HeLa WT cells overexpressing UPF3A. Isoforms containing GENCODE (release 33) annotated PTC (red, TRUE), regular stop codons (blue, FALSE) or having no annotated open reading frame (gray, NA) are indicated. The change in isoform fraction (dIF) is plotted against the ‐log10 adjusted P‐value (P adj). Density plots show the distribution of filtered isoforms in respect to the dIF, cutoffs were |dIF| > 0.1 and P adj < 0.05. P‐values were calculated by IsoformSwitchAnalyzeR using a DEXSeq‐based test and corrected for multiple testing using the Benjamini–Hochberg method. OE = overexpression.
Source data are available online for this figure.