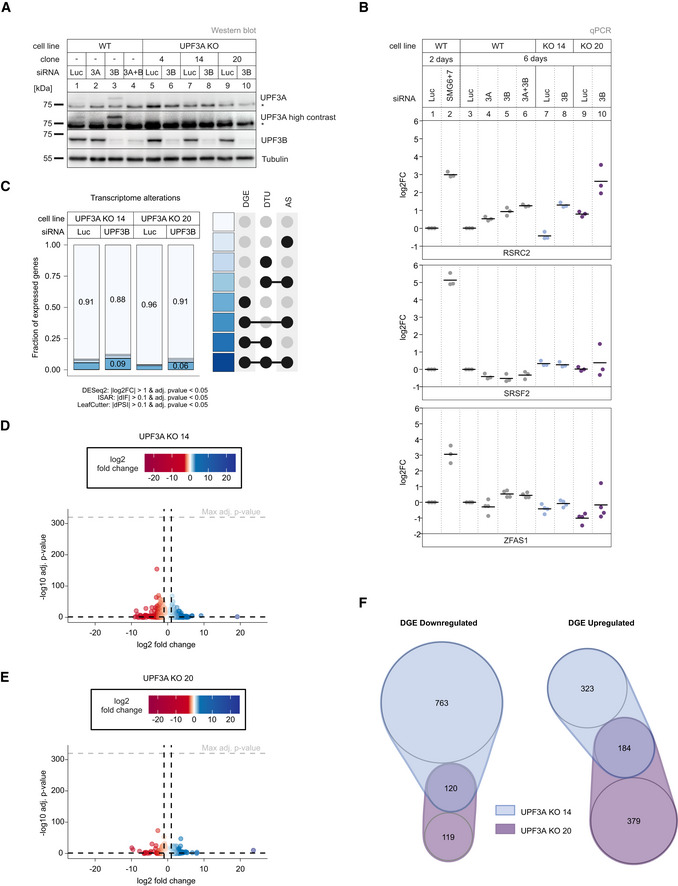
Figure 2. UPF3A KOs show light NMD‐independent transcriptome alterations.

-
AWestern blot analysis of WT and UPF3A KO cells (clones 4, 14, and 20) with the indicated siRNA treatments (n = 1). UPF3A and UPF3B protein levels were detected, Tubulin serves as control. The asterisk indicates unspecific bands.
-
BQuantitative RT–PCR of the indicated cell lines treated with the indicated siRNAs for 2 or 6 days. For RSRC2 and SRSF2 the ratio of NMD isoform to canonical isoform was calculated. ZFAS1 expression was normalized to C1orf43 reference. Data points and means are plotted as log2 fold change (log2FC) (n = 3 for RSRC2 and SRSF2, n = 4 for ZFAS1).
-
CFraction of expressed genes (genes with non‐zero counts in DESeq2) were calculated which exhibit individual or combinations of differential gene expression (DGE), differential transcript usage (DTU) and/or alternative splicing (AS) events in the indicated conditions using the respective computational analysis (cutoffs are indicated). AS and DTU events were collapsed on the gene level. For DGE, P‐values were calculated by DESeq2 using a two‐sided Wald test and corrected for multiple testing using the Benjamini–Hochberg method. For DTU, P‐values were calculated by IsoformSwitchAnalyzeR using a DEXSeq‐based test and corrected for multiple testing using the Benjamini–Hochberg method. For AS, P‐values were calculated by LeafCutter using an asymptotic chi‐squared distribution and corrected for multiple testing using the Benjamini–Hochberg method.
-
D, EVolcano plots showing the differential gene expression analyses from the indicated RNA‐Seq datasets (D UPF3A KO clone 14, E UPF3A KO clone 20). The log2 fold change is plotted against the −log10 adjusted P‐value (P adj). P‐values were calculated by DESeq2 using a two‐sided Wald test and corrected for multiple testing using the Benjamini–Hochberg method.
-
FnVenn Diagram showing the overlap of up‐ or downregulated genes in the UPF3A KO cell lines 14 and 20. Log2 fold change < 1 (downregulated) or > 1 (upregulated) and adjusted P‐value (P adj) < 0.05. DGE = Differential Gene Expression.
Source data are available online for this figure.
