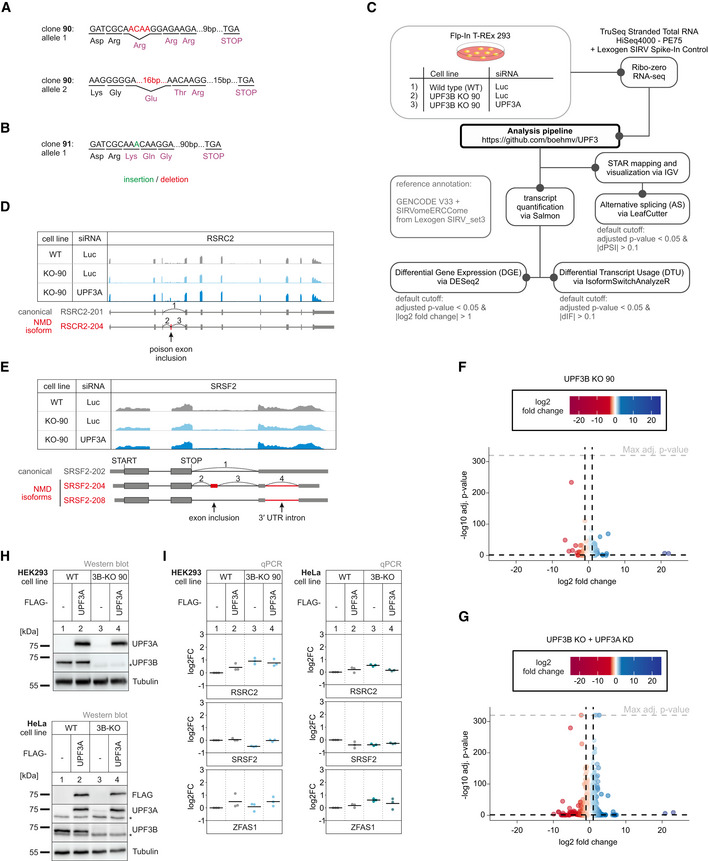
Figure EV3. No NMD inhibition by UPF3A in the absence of UPF3B.

-
A, BThe targeted exon region and anticipated PTC location following insertions (green) or deletions (red) are indicated for detected alleles of UPF3B in KO clone 90 (A) and 91 (B).
-
CSchematic overview of the analysis pipeline.
-
D, ERead coverage of RSRC2 (D) and SRSF2 (E) from the indicated RNA‐seq sample data with or without UPF3A siRNA treatment shown as Integrative Genomics Viewer (IGV) snapshot. The canonical and NMD‐sensitive isoforms are schematically indicated below.
-
F, GVolcano plots showing the differential gene expression analyses from the indicated RNA‐Seq datasets. The log2 fold change is plotted against the ‐log10 adjusted P‐value (P adj). P‐values were calculated by DESeq2 using a two‐sided Wald test and corrected for multiple testing using the Benjamini–Hochberg method.
-
HWestern blot analysis of HEK293 and HeLa WT and UPF3B KO cells (clone 90 for HEK293 cells) with or without expression of FLAG‐tagged UPF3A rescue construct (n = 1). UPF3A, UPF3B and FLAG protein levels were detected, Tubulin serves as control. The asterisk indicates unspecific bands.
-
IQuantitative RT–PCR of the HEK293 and HeLa samples from (H). For RSRC2 and SRSF2 the ratio of NMD isoform to canonical isoform was calculated. ZFAS1 expression was normalized to C1orf43 reference. Data points and means are plotted as log2 fold change (log2FC) (n = 3).
Source data are available online for this figure.
