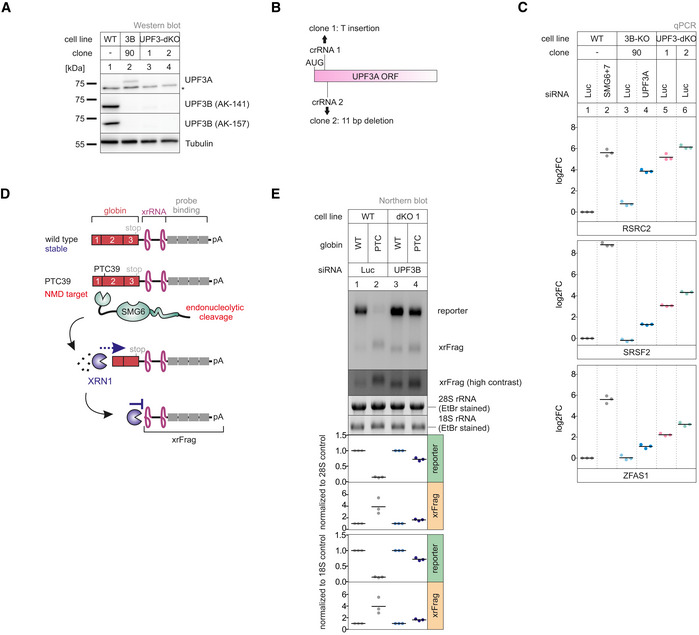
Figure 4. KO of both UPF3 paralogs results in strongly impaired NMD.

- Western blot analysis of WT, UPF3B KO, and UPF3A‐UPF3B double KO cells (clones 1 and 2) (n = 1). UPF3A and UPF3B protein levels were detected, Tubulin serves as control. The asterisk indicates unspecific bands.
- Schematic depiction of the insertion/deletion in the UPF3A open reading frame resulting in the additional UPF3A KO in the UPF3B KO clone 90 generating UPF3 dKO clones.
- Quantitative RT–PCR of the indicated samples with the indicated KDs. For RSRC2 and SRSF2, the ratio of NMD isoform to canonical isoform was calculated. ZFAS1 expression was normalized to C1orf43 reference. Data points and means are plotted as log2 fold change (log2FC, n = 3).
- Schematic overview of the globin reporter constructs and their functional elements.
- Northern blot analysis of globin reporter and xrFrag. Ethidium bromide stained 28S and 18S rRNAs are shown as controls. Quantification results are shown as data points and mean (n = 3).
Source data are available online for this figure.
