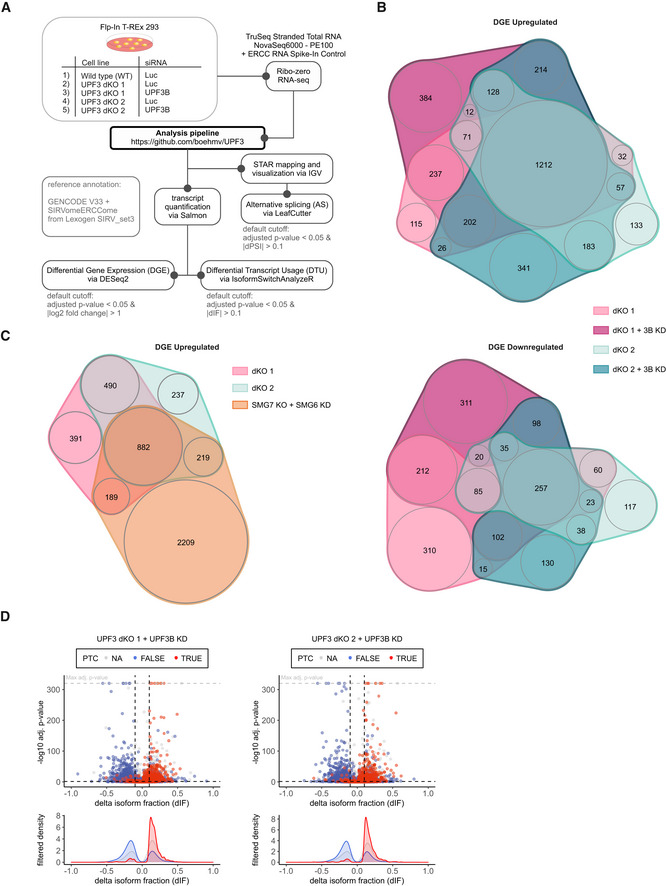
Figure EV4. Genes upregulated in UPF3 dKO cells are high confidence NMD targets.

- Schematic overview of the analysis pipeline.
- nVenn Diagrams showing the overlap of upregulated (upper panel) or downregulated genes (lower panel) in the UPF3 dKO cell lines 1 and 2, both with and without a supportive UPF3B KD. Log2 fold change < −1 (downregulated) or > 1 (upregulated) and adjusted P‐value (P adj) < 0.05. DGE = Differential Gene Expression.
- nVenn Diagram showing the overlap of upregulated genes in the two UPF3 dKO clones and previously analyzed SMG7 KO cells with SMG6 KD (Data ref.: Boehm et al, 2021) as control for cells with inhibited NMD. The overlap demonstrates high‐confidence NMD targets. Cut‐offs: log2FoldChange > 1 and adjusted P‐value (P adj) < 0.05. DGE = Differential Gene Expression.
- Volcano plots showing the differential transcript usage (via IsoformSwitchAnalyzeR) in various RNA‐Seq data. Isoforms containing GENCODE (release 33) annotated PTC (red, TRUE), regular stop codons (blue, FALSE) or having no annotated open reading frame (gray, NA) are indicated. The change in isoform fraction (dIF) is plotted against the ‐log10 adjusted P‐value (P adj). Density plots show the distribution of filtered isoforms in respect to the dIF, cutoffs were |dIF| > 0.1 and P adj < 0.05. P‐values were calculated by IsoformSwitchAnalyzeR using a DEXSeq‐based test and corrected for multiple testing using the Benjamini–Hochberg method.
