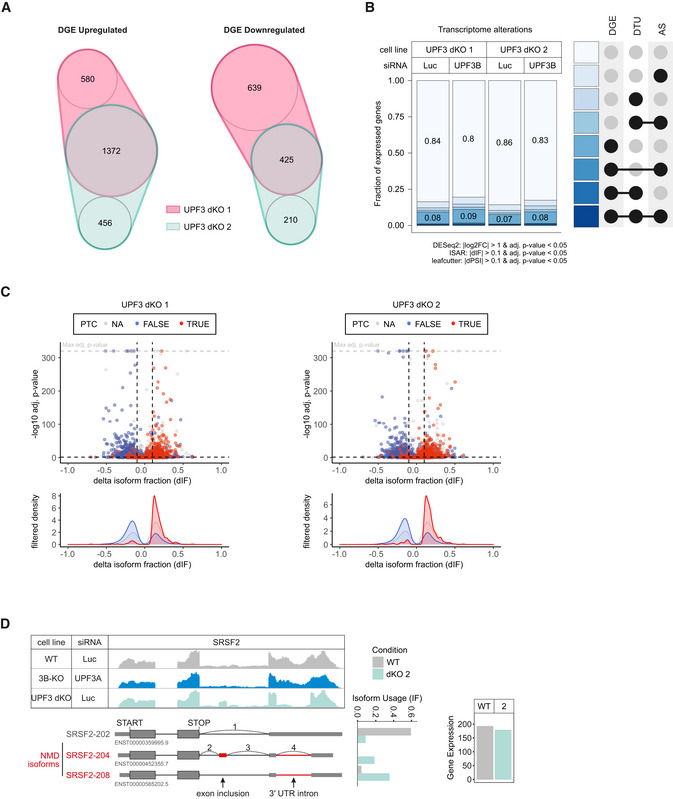
Figure 5. RNA‐seq reveals strong global upregulation of NMD‐sensitive targets upon UPF3 dKO in HEK293 cells.

- nVenn Diagram showing the overlap of up‐ or downregulated genes in the UPF3 dKO cell lines 1 and 2. Log2 fold change < −1 (downregulated) or > 1 (upregulated) and adjusted P‐value (P adj) < 0.05. DGE = Differential Gene Expression.
- Fraction of expressed genes (genes with non‐zero counts in DESeq2) were calculated which exhibit individual or combinations of differential gene expression (DGE), differential transcript usage (DTU), and/or alternative splicing (AS) events in the indicated conditions using the respective computational analysis (cutoffs are indicated). AS and DTU events were collapsed on the gene level. For DGE, P‐values were calculated by DESeq2 using a two‐sided Wald test and corrected for multiple testing using the Benjamini–Hochberg method. For DTU, P‐values were calculated by IsoformSwitchAnalyzeR using a DEXSeq‐based test and corrected for multiple testing using the Benjamini–Hochberg method. For AS, P‐values were calculated by LeafCutter using an asymptotic chi‐squared distribution and corrected for multiple testing using the Benjamini–Hochberg method.
- Volcano plots showing the differential transcript usage (via IsoformSwitchAnalyzeR) in various RNA‐Seq data. Isoforms containing GENCODE (release 33) annotated PTC (red, TRUE), regular stop codons (blue, FALSE) or having no annotated open reading frame (gray, NA) are indicated. The change in isoform fraction (dIF) is plotted against the ‐log10 adjusted P‐value (P adj). Density plots show the distribution of filtered isoforms in respect to the dIF, cutoffs were |dIF| > 0.1 and P adj < 0.05. P‐values were calculated by IsoformSwitchAnalyzeR using a DEXSeq‐based test and corrected for multiple testing using the Benjamini–Hochberg method.
- Read coverage of SRSF2 from the indicated RNA‐seq sample data with or without UPF3A siRNA treatment shown as Integrative Genomics Viewer (IGV) snapshot. The canonical and NMD‐sensitive isoforms are schematically indicated below. Quantification of gene expression and isoform usage by IsoformSwitchAnalyzeR (right).
