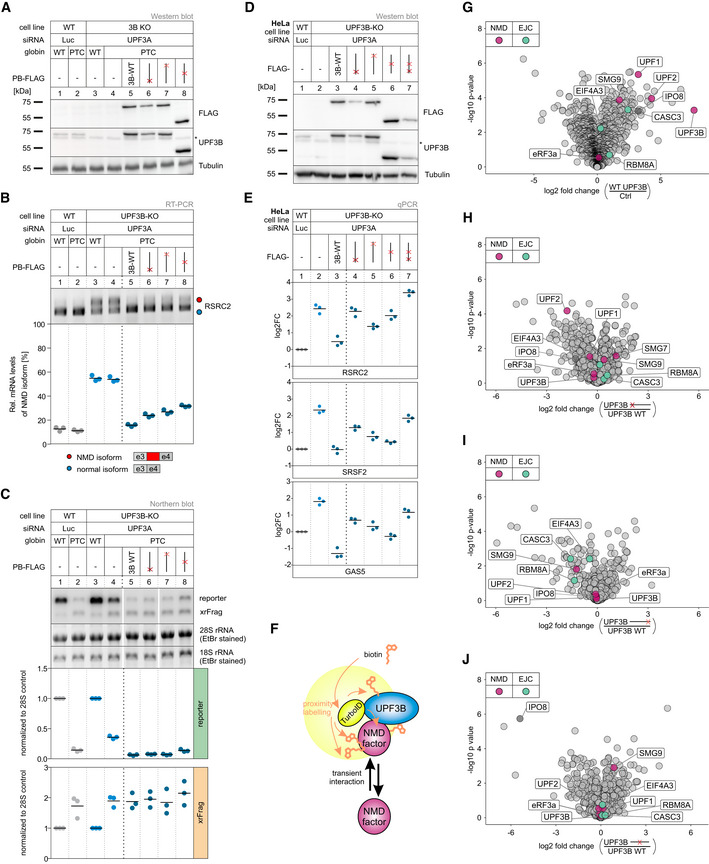
Figure EV5. Single mutations do not destroy UPF3B NMD functionality in HEK293 and HeLa cells.

-
AWestern blot analysis of WT and UPF3B KO clone 90 cells with Luciferase and UPF3A KD, respectively. Monitored expression of globin WT and PTC39 reporters and the indicated UPF3B rescue constructs. Rescue construct protein levels were detected with anti‐FLAG and anti‐UPF3B (AK‐141) antibodies. Tubulin serves as control (n = 1). The asterisk indicates an unspecific band.
-
BEnd‐point RT–PCR detection of RSRC2 transcript isoforms in the samples from (A). The detected RSRC2 isoforms are indicated on the bottom, the NMD‐inducing included exon is marked in red (e = exon). Relative mRNA levels of RSRC2 isoforms were quantified from bands of agarose gels (n = 3).
-
CNorthern blot analysis of globin reporter and xrFrag. Ethidium bromide stained 28S and 18S rRNAs are shown as controls. Lanes 5 and 6 were mirrored because of a pipetting error. Quantification results are shown as data points and mean (n = 3).
-
DWestern blot analysis of HeLa WT and UPF3B KO cells with Luciferase and UPF3A KDs respectively. Monitored expression of the FLAG‐tagged UPF3B rescue construct shown in (Fig 6D). Rescue construct protein levels were detected with anti‐FLAG and anti‐UPF3B (AK‐141) antibodies. Tubulin serves as control (n = 1). The asterisk indicates an unspecific band.
-
EQuantitative RT–PCR of the samples from (D). For RSRC2 and SRSF2, the ratio of NMD isoform to canonical isoform was calculated. GAS5 expression was normalized to EMC7 reference. Data points and means are plotted as log2 fold change (n = 3).
-
FOverview of TurboID‐mediated proximity labeling of UPF3B WT and UPF3B mutant construct binding partners in UPF3B KO clone 90 with additional UPF3A KD. Transient UPF3B interactors are marked with biotin via TurboID catalysis. Biotinylated proteins are subsequently enriched with streptavidin beads.
-
G–JVolcano plots of mass spectrometry‐based analysis of streptavidin‐enriched biotinylated proteins in the respective comparison of conditions. (G) FLAG‐TurboID‐UPF3B against FLAG‐TurboID control, (H) FLAG‐TurboID‐UPF3B ΔUPF2 interaction (K52D/RR56EE) against FLAG‐TurboID‐UPF3B, (I) FLAG‐TurboID‐UPF3B ΔEJC interaction (Δ421–434) against FLAG‐TurboID‐UPF3B, (J) FLAG‐TurboID‐UPF3B Δmiddle domain (Δ147–256) against FLAG‐TurboID‐UPF3B, all in UPF3B KO + UPF3A KD cells. Points labeled in purple indicate NMD factors; points labeled in turquoise indicate EJC components (n = 3 biologically independent samples).
Source data are available online for this figure.
