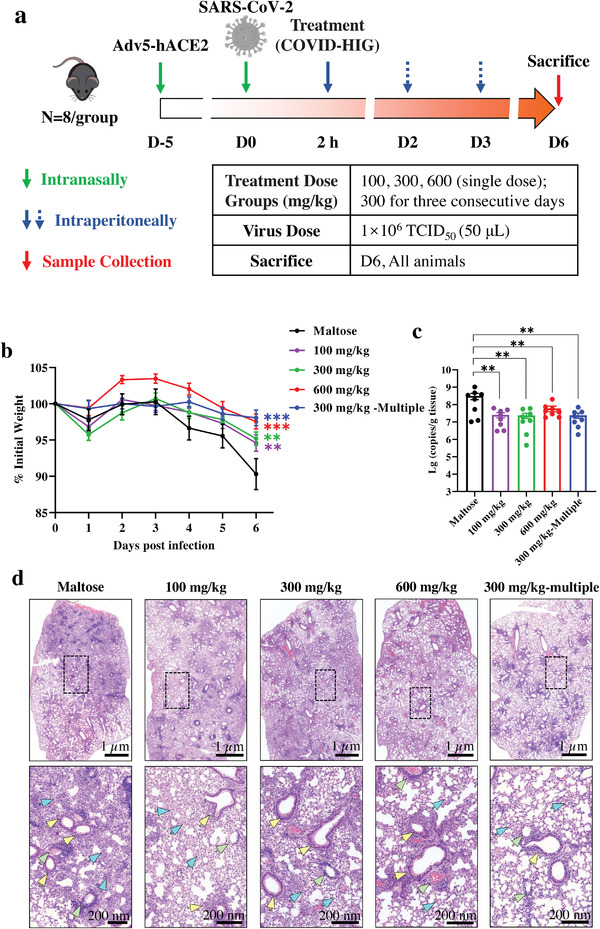
Figure 6.

Therapeutic treatment with COVID‐HIG protects mice from SARS‐CoV‐2 infection. a) Experimental design. Adv5‐hACE2‐transduced mice were intraperitoneally injected once with 600, 300, or 100 mg kg−1 COVID‐HIG 2 h after SARS‐CoV‐2 infection (n = 8 per group). Another group was injected with 300 mg kg−1 COVID‐HIG 0, 1, and 2 d after SARS‐CoV‐2 infection (therapeutic treatment, n = 8 per group). The control group was injected with 200 µL 10% maltose 2 h after (control) SARS‐CoV‐2 infection (n = 8 per group). b) Daily body weight changes of COVID‐HIG therapeutic group or maltose‐treated mice. Data are shown as the mean ± SEM of n = 8 animals per group. Statistical significance was determined using two‐way ANOVA. *P < 0.05, **P < 0.01, ***P < 0.001. c) Viral RNA levels in the lung tissues of the COVID‐HIG therapeutic group or maltose‐treated mice were determined using qRT‐PCR at 6 day‐post‐infection. Data are represented as the mean ± SEM of n = 8 animals per group. Statistical significance was determined using one‐way ANOVA. **P < 0.01, ***P < 0.001. d) Histopathological analyses of COVID‐HIG‐treated or untreated mice challenged with SARS‐CoV‐2. Representative images of lung sections stained with hematoxylin and eosin at 6 day‐post‐challenge. Blue arrows indicate pathological changes to the alveolar wall and alveolar cavity. Yellow arrows indicate bronchiole lesions. Green arrows indicate pathological changes to the blood vessels. The image in the lower panel is an enlarged view of the black dotted box in the image in the upper panel.
