
Figure 3.
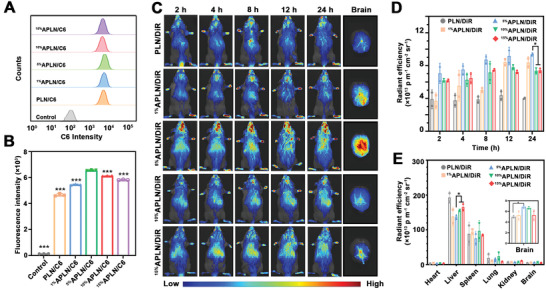
Analysis of BBB penetration both in vitro and in vivo. A) Flow cytometric analysis of hCMEC/D3 cellular uptake after treated with different formulations for 4 h (n = 3). B) The mean C6 fluorescence intensity of hCMEC/D3 cells treated with various nanoparticles. Compared with the 5% APLN/C6 group (n = 3). C) In vivo imaging of mice administrated with PLN/DiR with various αAng densities of 1%, 5%, 10%, and 15% and ex vivo imaging of brains in different groups after 24 h. D) Quantitative assessment of in vivo fluorescence intensity of brains at different time intervals (n = 3). E) The quantitative fluorescence intensity of major organs (n = 3). Data were presented as Mean ± SD. *p < 0.05 and ***p < 0.001.