Figure 4.

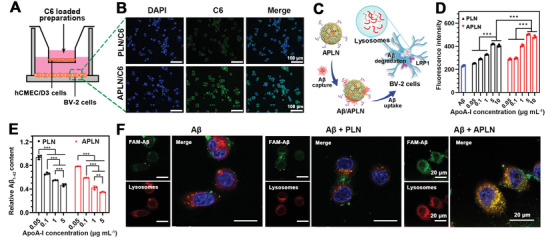
Microglial targeting and the promotion of microglial uptake and degradation of Aβ. A) Schematic illustration of BBB Transwell model. B) Fluorescence images of cellular uptake of PLN/C6 and APLN/C6 in microglia, respectively. Scale bar = 100 µm. C) Scheme of APLN promoting Aβ uptake and degradation by microglia. D) Cellular uptake of FAM‐Aβ 1‐42 in microglia in the absence or presence of PLN and APLN at different apoA‐I concentrations, respectively (n = 3). E) Relative intracellular Aβ were quantified by ELISA after coincubation with Aβ and APLN or PLN (n = 3). F) CLSM images showing FAM‐Aβ 1‐42 clearance by lysosomal network in the absence or presence of APLN (or PLN) after incubation for 4 h, respectively. Scale bar = 20 µm. Data were presented as mean ± SD. **p < 0.01 and ***p < 0.001.
