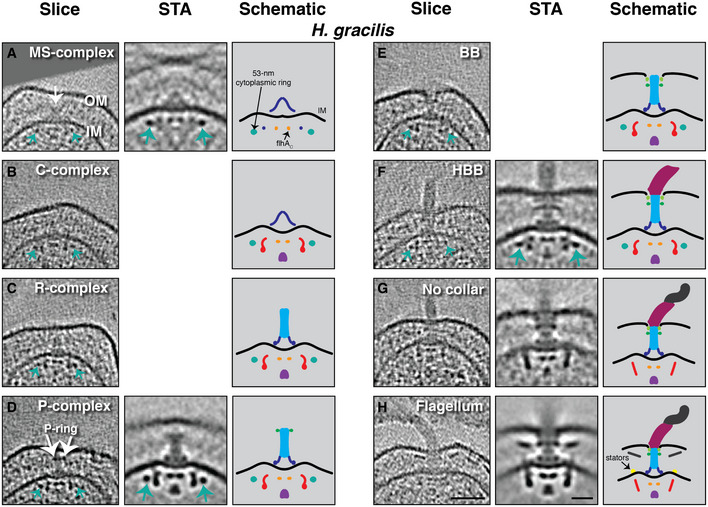
Figure 2. The flagellar assembly pathway of the Betaproteobacterium Hylemonella gracilis .

-
A–HSlices through electron cryotomograms of H. gracilis cells (left panels), central slices through subtomogram averages (STA, middle panels), and schematic representations (right panels) representing the various assembly stages observed. White arrow in (A) points to the MS‐complex; green arrows point to the novel 55‐nm‐wide cytoplasmic ring. Scale bars in (H) are 50 nm for the cryotomogram slice and 20 nm for the STA and apply to all panels. Empty panels represent stages where not enough particles were found to produce a STA. OM, outer membrane; IM, inner membrane.
