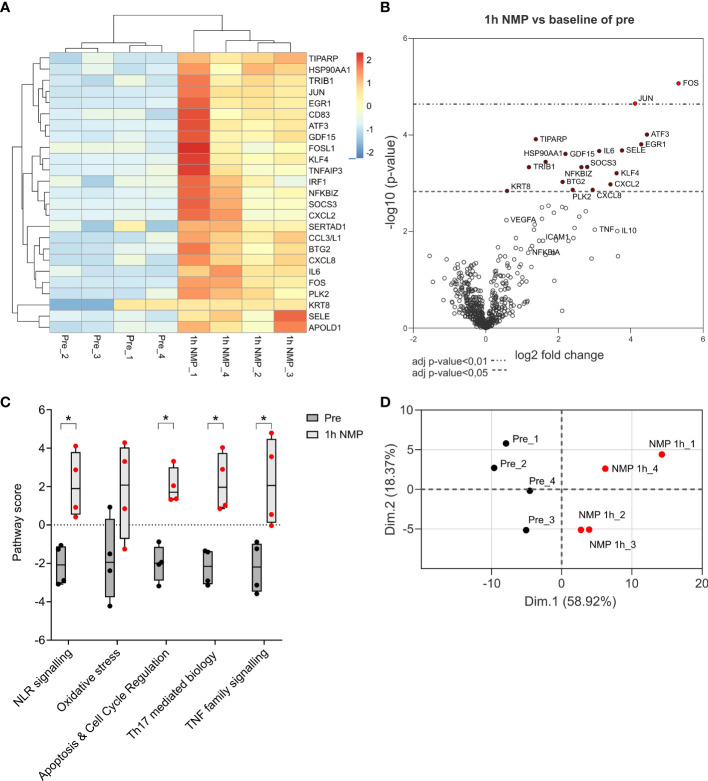
Figure 3.
Nanostring nCounter Organ Transplant Panel analysis of 4 cortex samples of kidneys comparing transcriptional analysis of differential expressed genes after 1h NMP compared to baseline pre samples. Total RNA was isolated and processed. (A) Heatmap of the top 25 significantly differentially expressed genes. (B) Volcano plot represents differential gene expression after 1h NMP. Difference in gene expression level with p-value adjusted <0.01 or <0.05 are marked by red dots. (C) Top 5 pathways up-regulated after NMP. Statistical significance was calculated by Mann Whitney test (*, p<0.05). (D) Principal component analysis on the top 100 differentially expressed genes.

