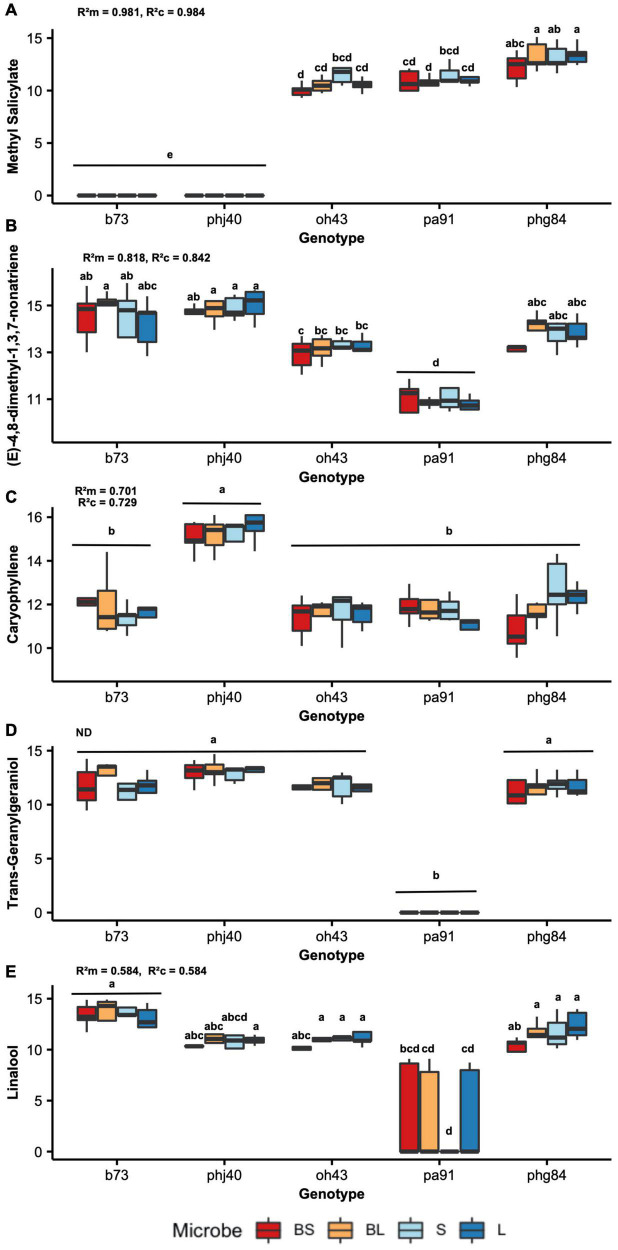
FIGURE 1.
Individual herbivore-induced volatile compound (HIPV) quantities by maize genotype (x-axis) and microbe treatment (color, see key on bottom). Random forest model was used to rank individual HIPV based on importance (using MDA score). Peak area quantities were log10 + 1 transformed to assume normality. Tukey’s honestly significant difference was used to group means, the results of which are denoted on each boxplot. 2-Way ANOVA coefficients of determination (conditional and marginal, R2c, and R2m, respectively) are indicated on each graph: (A) Methyl salicylate, (B) (E)-4,8-dimethyl-1,3,7-nonatriene, (C) caryophyllene, (D) Trans-Geranylgeraniol, and (E) linalool are shown. Coefficient of determination of Trans-Geranylgeraniol is not shown, due to violations of assumptions (denotes with “ns”).

