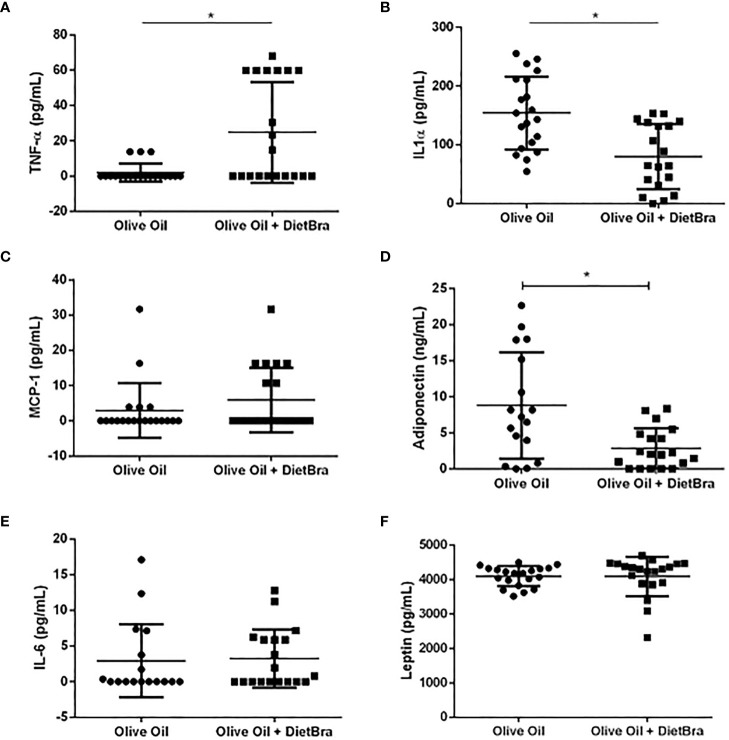
Figure 3.
Comparisons of inflammatory biomarkers at the end of the intervention between two intervention groups. (A) TNF-α; (B) IL-1α; (C) MCP-1; (D) adiponectin; (E) IL-6; (F) leptin. Differences in TNF-α, MCP-1 adiponectin IL-6 and leptin were analyzed by the Mann-Whitney test and the difference in IL-lα was analyzed by the independent t-test. *p<0.05.

