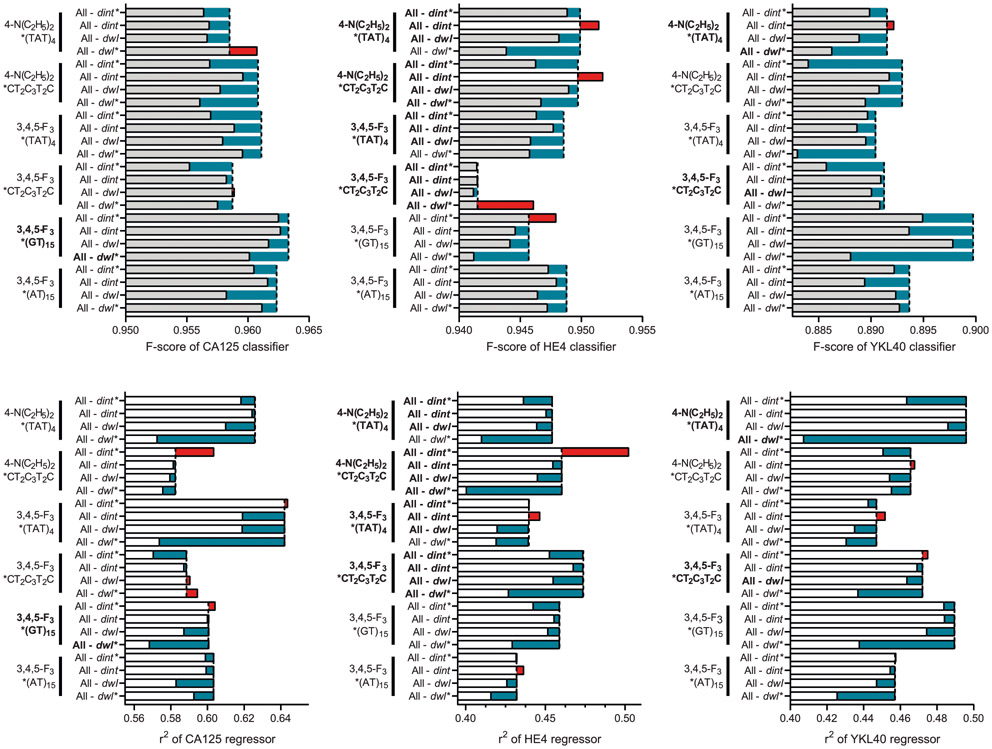
Extended Data Fig. 8 ∣. Correlation of F-score and r2 of the biomarker prediction models with the relative feature importance of each spectroscopic variable.
For the binary classification models (top rows), samples were divided into two groups–abnormal vs. normal levels of serum biomarkers–based on the clinical references (CA125: 50 U/mL, HE4: 150 pM, YKL40: 1650 pM) and assessed the prediction accuracy of abnormal levels of each biomarker. Feature importance of the prediction models shows which spectral parameters most impacted the model performance using an ablation study. Biomarker dependent variables that were identified in Extended Data Fig. 4 are highlighted in bold. Vertical dashed lines indicate F-score when all four spectroscopic variables (dint, dint*, dwl, and dwl*) of the OCC-DNA were included as feature vectors in the model development.

