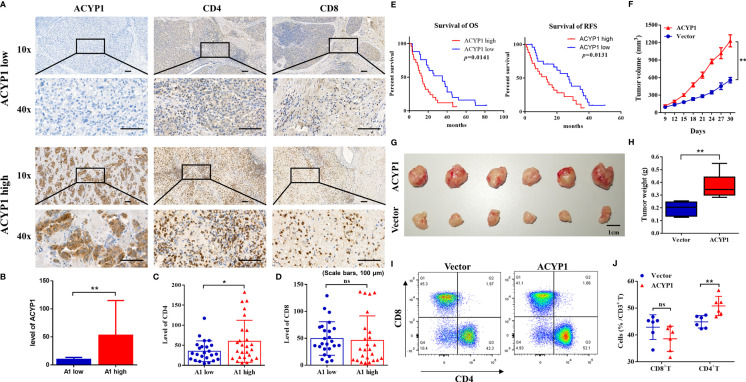
Figure 6.
Preliminary experimental verification of the ACYP1 signature in LIHC. (A) Representative samples with low and high ACYP1 expression for IHC staining of ACYP1, CD4+ and CD8+ T cells in the ACYP1 low and high group were taken at 100x and 400x magnification. (B–D) Relative quantitative analysis of ACYP1 (B), CD4 (C) and CD8 (D) levels by IHC staining. (E) Survival analysis of the ACYP1 high group and the ACYP1 low group in 50 LIHC patients. (F) Subcutaneous growth of Hep1-6 tumors in the vector group and ACYP1 overexpression group (n=6). (G) Representative images of subcutaneous Hep1-6 tumors in the vector group and ACYP1 overexpression group (n=6). (H) The weight of subcutaneous Hep1-6 tumors in vector group and ACYP1 overexpression group (n=6). (I, J) The relative content of CD4+ T cells and CD8+ T cells in subcutaneous Hep1-6 tumors from vector mice and ACYP1 overexpressing mice (n=6). Positive cell percentages are shown. *P < 0.05, **P < 0.01, n.s. "no significance".

